long-term care use and supply in europe: projections for germany ...
long-term care use and supply in europe: projections for germany ...
long-term care use and supply in europe: projections for germany ...
Create successful ePaper yourself
Turn your PDF publications into a flip-book with our unique Google optimized e-Paper software.
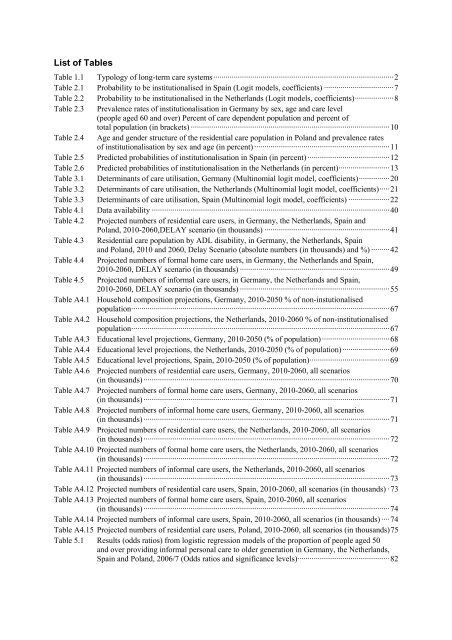
List of Tables<br />
Table 1.1 Typology of <strong>long</strong>-<strong>term</strong> <strong>care</strong> systems ························································································ 2<br />
Table 2.1 Probability to be <strong>in</strong>stitutionalised <strong>in</strong> Spa<strong>in</strong> (Logit models, coefficients) ·································· 7<br />
Table 2.2 Probability to be <strong>in</strong>stitutionalised <strong>in</strong> the Netherl<strong>and</strong>s (Logit models, coefficients) ··················· 8<br />
Table 2.3 Prevalence rates of <strong>in</strong>stitutionalisation <strong>in</strong> Germany by sex, age <strong>and</strong> <strong>care</strong> level<br />
(people aged 60 <strong>and</strong> over) Percent of <strong>care</strong> dependent population <strong>and</strong> percent of<br />
total population (<strong>in</strong> brackets) ································································································· 10<br />
Table 2.4 Age <strong>and</strong> gender structure of the residential <strong>care</strong> population <strong>in</strong> Pol<strong>and</strong> <strong>and</strong> prevalence rates<br />
of <strong>in</strong>stitutionalisation by sex <strong>and</strong> age (<strong>in</strong> percent) ·································································· 11<br />
Table 2.5 Predicted probabilities of <strong>in</strong>stitutionalisation <strong>in</strong> Spa<strong>in</strong> (<strong>in</strong> percent) ········································ 12<br />
Table 2.6 Predicted probabilities of <strong>in</strong>stitutionalisation <strong>in</strong> the Netherl<strong>and</strong>s (<strong>in</strong> percent)························· 13<br />
Table 3.1 De<strong>term</strong><strong>in</strong>ants of <strong>care</strong> utilisation, Germany (Mult<strong>in</strong>omial logit model, coefficients) ··············· 20<br />
Table 3.2 De<strong>term</strong><strong>in</strong>ants of <strong>care</strong> utilisation, the Netherl<strong>and</strong>s (Mult<strong>in</strong>omial logit model, coefficients) ····· 21<br />
Table 3.3 De<strong>term</strong><strong>in</strong>ants of <strong>care</strong> utilisation, Spa<strong>in</strong> (Mult<strong>in</strong>omial logit model, coefficients) ···················· 22<br />
Table 4.1 Data availability ···················································································································· 40<br />
Table 4.2 Projected numbers of residential <strong>care</strong> <strong>use</strong>rs, <strong>in</strong> Germany, the Netherl<strong>and</strong>s, Spa<strong>in</strong> <strong>and</strong><br />
Pol<strong>and</strong>, 2010-2060,DELAY scenario (<strong>in</strong> thous<strong>and</strong>s) ····························································· 41<br />
Table 4.3 Residential <strong>care</strong> population by ADL disability, <strong>in</strong> Germany, the Netherl<strong>and</strong>s, Spa<strong>in</strong><br />
<strong>and</strong> Pol<strong>and</strong>, 2010 <strong>and</strong> 2060, Delay Scenario (absolute numbers (<strong>in</strong> thous<strong>and</strong>s) <strong>and</strong> %) ········· 42<br />
Table 4.4 Projected numbers of <strong>for</strong>mal home <strong>care</strong> <strong>use</strong>rs, <strong>in</strong> Germany, the Netherl<strong>and</strong>s <strong>and</strong> Spa<strong>in</strong>,<br />
2010-2060, DELAY scenario (<strong>in</strong> thous<strong>and</strong>s) ········································································· 49<br />
Table 4.5 Projected numbers of <strong>in</strong><strong>for</strong>mal <strong>care</strong> <strong>use</strong>rs, <strong>in</strong> Germany, the Netherl<strong>and</strong>s <strong>and</strong> Spa<strong>in</strong>,<br />
2010-2060, DELAY scenario (<strong>in</strong> thous<strong>and</strong>s) ········································································· 55<br />
Table A4.1 Ho<strong>use</strong>hold composition <strong>projections</strong>, Germany, 2010-2050 % of non-<strong>in</strong>stutionalised<br />
population ······························································································································ 67<br />
Table A4.2 Ho<strong>use</strong>hold composition <strong>projections</strong>, the Netherl<strong>and</strong>s, 2010-2060 % of non-<strong>in</strong>stitutionalised<br />
population ······························································································································ 67<br />
Table A4.3 Educational level <strong>projections</strong>, Germany, 2010-2050 (% of population) ································· 68<br />
Table A4.4 Educational level <strong>projections</strong>, the Netherl<strong>and</strong>s, 2010-2050 (% of population) ······················· 69<br />
Table A4.5 Educational level <strong>projections</strong>, Spa<strong>in</strong>, 2010-2050 (% of population) ······································· 69<br />
Table A4.6 Projected numbers of residential <strong>care</strong> <strong>use</strong>rs, Germany, 2010-2060, all scenarios<br />
(<strong>in</strong> thous<strong>and</strong>s) ························································································································ 70<br />
Table A4.7 Projected numbers of <strong>for</strong>mal home <strong>care</strong> <strong>use</strong>rs, Germany, 2010-2060, all scenarios<br />
(<strong>in</strong> thous<strong>and</strong>s) ························································································································ 71<br />
Table A4.8 Projected numbers of <strong>in</strong><strong>for</strong>mal home <strong>care</strong> <strong>use</strong>rs, Germany, 2010-2060, all scenarios<br />
(<strong>in</strong> thous<strong>and</strong>s) ························································································································ 71<br />
Table A4.9 Projected numbers of residential <strong>care</strong> <strong>use</strong>rs, the Netherl<strong>and</strong>s, 2010-2060, all scenarios<br />
(<strong>in</strong> thous<strong>and</strong>s) ························································································································ 72<br />
Table A4.10 Projected numbers of <strong>for</strong>mal home <strong>care</strong> <strong>use</strong>rs, the Netherl<strong>and</strong>s, 2010-2060, all scenarios<br />
(<strong>in</strong> thous<strong>and</strong>s) ························································································································ 72<br />
Table A4.11 Projected numbers of <strong>in</strong><strong>for</strong>mal <strong>care</strong> <strong>use</strong>rs, the Netherl<strong>and</strong>s, 2010-2060, all scenarios<br />
(<strong>in</strong> thous<strong>and</strong>s) ························································································································ 73<br />
Table A4.12 Projected numbers of residential <strong>care</strong> <strong>use</strong>rs, Spa<strong>in</strong>, 2010-2060, all scenarios (<strong>in</strong> thous<strong>and</strong>s) · 73<br />
Table A4.13 Projected numbers of <strong>for</strong>mal home <strong>care</strong> <strong>use</strong>rs, Spa<strong>in</strong>, 2010-2060, all scenarios<br />
(<strong>in</strong> thous<strong>and</strong>s) ························································································································ 74<br />
Table A4.14 Projected numbers of <strong>in</strong><strong>for</strong>mal <strong>care</strong> <strong>use</strong>rs, Spa<strong>in</strong>, 2010-2060, all scenarios (<strong>in</strong> thous<strong>and</strong>s) ···· 74<br />
Table A4.15 Projected numbers of residential <strong>care</strong> <strong>use</strong>rs, Pol<strong>and</strong>, 2010-2060, all scenarios (<strong>in</strong> thous<strong>and</strong>s) 75<br />
Table 5.1 Results (odds ratios) from logistic regression models of the proportion of people aged 50<br />
<strong>and</strong> over provid<strong>in</strong>g <strong>in</strong><strong>for</strong>mal personal <strong>care</strong> to older generation <strong>in</strong> Germany, the Netherl<strong>and</strong>s,<br />
Spa<strong>in</strong> <strong>and</strong> Pol<strong>and</strong>, 2006/7 (Odds ratios <strong>and</strong> significance levels) ············································· 82


