annual report 2008-09 - IRDA
annual report 2008-09 - IRDA
annual report 2008-09 - IRDA

You also want an ePaper? Increase the reach of your titles
YUMPU automatically turns print PDFs into web optimized ePapers that Google loves.
ANNUAL REPORT <strong>2008</strong>-<strong>09</strong><br />
TABLE 23<br />
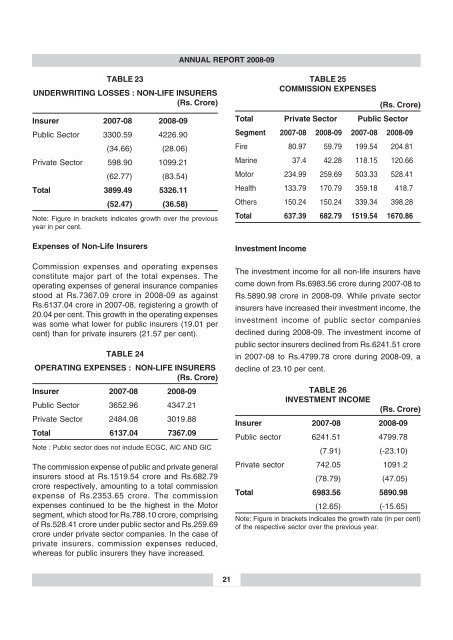
UNDERWRITING LOSSES : NON-LIFE INSURERS<br />
(Rs. Crore)<br />
Insurer 2007-08 <strong>2008</strong>-<strong>09</strong><br />
Public Sector 3300.59 4226.90<br />
(34.66) (28.06)<br />
Private Sector 598.90 1<strong>09</strong>9.21<br />
(62.77) (83.54)<br />
Total 3899.49 5326.11<br />
(52.47) (36.58)<br />
Note: Figure in brackets indicates growth over the previous<br />
year in per cent.<br />
Expenses of Non-Life Insurers<br />
Commission expenses and operating expenses<br />
constitute major part of the total expenses. The<br />
operating expenses of general insurance companies<br />
stood at Rs.7367.<strong>09</strong> crore in <strong>2008</strong>-<strong>09</strong> as against<br />
Rs.6137.04 crore in 2007-08, registering a growth of<br />
20.04 per cent. This growth in the operating expenses<br />
was some what lower for public insurers (19.01 per<br />
cent) than for private insurers (21.57 per cent).<br />
TABLE 24<br />
OPERATING EXPENSES : NON-LIFE INSURERS<br />
(Rs. Crore)<br />
Insurer 2007-08 <strong>2008</strong>-<strong>09</strong><br />
Public Sector 3652.96 4347.21<br />
Private Sector 2484.08 3019.88<br />
Total 6137.04 7367.<strong>09</strong><br />
Note : Public sector does not include ECGC, AIC AND GIC<br />
The commission expense of public and private general<br />
insurers stood at Rs.1519.54 crore and Rs.682.79<br />
crore respectively, amounting to a total commission<br />
expense of Rs.2353.65 crore. The commission<br />
expenses continued to be the highest in the Motor<br />
segment, which stood for Rs.788.10 crore, comprising<br />
of Rs.528.41 crore under public sector and Rs.259.69<br />
crore under private sector companies. In the case of<br />
private insurers, commission expenses reduced,<br />
whereas for public insurers they have increased.<br />
TABLE 25<br />
COMMISSION EXPENSES<br />
(Rs. Crore)<br />
Total Private Sector Public Sector<br />
Segment 2007-08 <strong>2008</strong>-<strong>09</strong> 2007-08 <strong>2008</strong>-<strong>09</strong><br />
Fire 80.97 59.79 199.54 204.81<br />
Marine 37.4 42.28 118.15 120.66<br />
Motor 234.99 259.69 503.33 528.41<br />
Health 133.79 170.79 359.18 418.7<br />
Others 150.24 150.24 339.34 398.28<br />
Total 637.39 682.79 1519.54 1670.86<br />
Investment Income<br />
The investment income for all non-life insurers have<br />
come down from Rs.6983.56 crore during 2007-08 to<br />
Rs.5890.98 crore in <strong>2008</strong>-<strong>09</strong>. While private sector<br />
insurers have increased their investment income, the<br />
investment income of public sector companies<br />
declined during <strong>2008</strong>-<strong>09</strong>. The investment income of<br />
public sector insurers declined from Rs.6241.51 crore<br />
in 2007-08 to Rs.4799.78 crore during <strong>2008</strong>-<strong>09</strong>, a<br />
decline of 23.10 per cent.<br />
TABLE 26<br />
INVESTMENT INCOME<br />
(Rs. Crore)<br />
Insurer 2007-08 <strong>2008</strong>-<strong>09</strong><br />
Public sector 6241.51 4799.78<br />
(7.91) (-23.10)<br />
Private sector 742.05 1<strong>09</strong>1.2<br />
(78.79) (47.05)<br />
Total 6983.56 5890.98<br />
(12.65) (-15.65)<br />
Note: Figure in brackets indicates the growth rate (in per cent)<br />
of the respective sector over the previous year.<br />
21