annual report 2008-09 - IRDA
annual report 2008-09 - IRDA
annual report 2008-09 - IRDA

Create successful ePaper yourself
Turn your PDF publications into a flip-book with our unique Google optimized e-Paper software.
ANNUAL REPORT <strong>2008</strong>-<strong>09</strong><br />
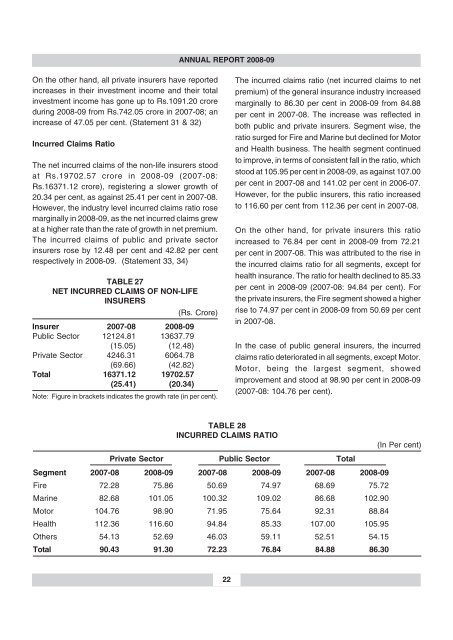
On the other hand, all private insurers have <strong>report</strong>ed<br />
increases in their investment income and their total<br />
investment income has gone up to Rs.1<strong>09</strong>1.20 crore<br />
during <strong>2008</strong>-<strong>09</strong> from Rs.742.05 crore in 2007-08; an<br />
increase of 47.05 per cent. (Statement 31 & 32)<br />
Incurred Claims Ratio<br />
The net incurred claims of the non-life insurers stood<br />
at Rs.19702.57 crore in <strong>2008</strong>-<strong>09</strong> (2007-08:<br />
Rs.16371.12 crore), registering a slower growth of<br />
20.34 per cent, as against 25.41 per cent in 2007-08.<br />
However, the industry level incurred claims ratio rose<br />
marginally in <strong>2008</strong>-<strong>09</strong>, as the net incurred claims grew<br />
at a higher rate than the rate of growth in net premium.<br />
The incurred claims of public and private sector<br />
insurers rose by 12.48 per cent and 42.82 per cent<br />
respectively in <strong>2008</strong>-<strong>09</strong>. (Statement 33, 34)<br />
TABLE 27<br />
NET INCURRED CLAIMS OF NON-LIFE<br />
INSURERS<br />
(Rs. Crore)<br />
Insurer 2007-08 <strong>2008</strong>-<strong>09</strong><br />
Public Sector 12124.81 13637.79<br />
(15.05) (12.48)<br />
Private Sector 4246.31 6064.78<br />
(69.66) (42.82)<br />
Total 16371.12 19702.57<br />
(25.41) (20.34)<br />
Note: Figure in brackets indicates the growth rate (in per cent).<br />
The incurred claims ratio (net incurred claims to net<br />
premium) of the general insurance industry increased<br />
marginally to 86.30 per cent in <strong>2008</strong>-<strong>09</strong> from 84.88<br />
per cent in 2007-08. The increase was reflected in<br />
both public and private insurers. Segment wise, the<br />
ratio surged for Fire and Marine but declined for Motor<br />
and Health business. The health segment continued<br />
to improve, in terms of consistent fall in the ratio, which<br />
stood at 105.95 per cent in <strong>2008</strong>-<strong>09</strong>, as against 107.00<br />
per cent in 2007-08 and 141.02 per cent in 2006-07.<br />
However, for the public insurers, this ratio increased<br />
to 116.60 per cent from 112.36 per cent in 2007-08.<br />
On the other hand, for private insurers this ratio<br />
increased to 76.84 per cent in <strong>2008</strong>-<strong>09</strong> from 72.21<br />
per cent in 2007-08. This was attributed to the rise in<br />
the incurred claims ratio for all segments, except for<br />
health insurance. The ratio for health declined to 85.33<br />
per cent in <strong>2008</strong>-<strong>09</strong> (2007-08: 94.84 per cent). For<br />
the private insurers, the Fire segment showed a higher<br />
rise to 74.97 per cent in <strong>2008</strong>-<strong>09</strong> from 50.69 per cent<br />
in 2007-08.<br />
In the case of public general insurers, the incurred<br />
claims ratio deteriorated in all segments, except Motor.<br />
Motor, being the largest segment, showed<br />
improvement and stood at 98.90 per cent in <strong>2008</strong>-<strong>09</strong><br />
(2007-08: 104.76 per cent).<br />
TABLE 28<br />
INCURRED CLAIMS RATIO<br />
(In Per cent)<br />
Private Sector Public Sector Total<br />
Segment 2007-08 <strong>2008</strong>-<strong>09</strong> 2007-08 <strong>2008</strong>-<strong>09</strong> 2007-08 <strong>2008</strong>-<strong>09</strong><br />
Fire 72.28 75.86 50.69 74.97 68.69 75.72<br />
Marine 82.68 101.05 100.32 1<strong>09</strong>.02 86.68 102.90<br />
Motor 104.76 98.90 71.95 75.64 92.31 88.84<br />
Health 112.36 116.60 94.84 85.33 107.00 105.95<br />
Others 54.13 52.69 46.03 59.11 52.51 54.15<br />
Total 90.43 91.30 72.23 76.84 84.88 86.30<br />
22