annual report 2008-09 - IRDA
annual report 2008-09 - IRDA
annual report 2008-09 - IRDA

Create successful ePaper yourself
Turn your PDF publications into a flip-book with our unique Google optimized e-Paper software.
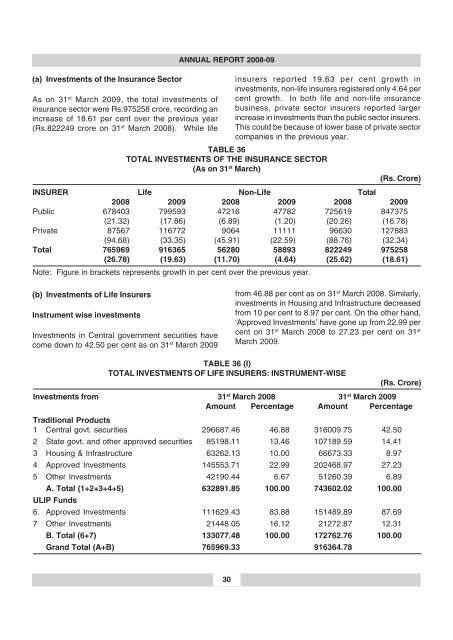
(a) Investments of the Insurance Sector<br />
As on 31 st March 20<strong>09</strong>, the total investments of<br />
insurance sector were Rs.975258 crore, recording an<br />
increase of 18.61 per cent over the previous year<br />
(Rs.822249 crore on 31 st March <strong>2008</strong>). While life<br />
ANNUAL REPORT <strong>2008</strong>-<strong>09</strong><br />
insurers <strong>report</strong>ed 19.63 per cent growth in<br />
investments, non-life insurers registered only 4.64 per<br />
cent growth. In both life and non-life insurance<br />
business, private sector insurers <strong>report</strong>ed larger<br />
increase in investments than the public sector insurers.<br />
This could be because of lower base of private sector<br />
companies in the previous year.<br />
TABLE 36<br />
TOTAL INVESTMENTS OF THE INSURANCE SECTOR<br />
(As on 31 st March)<br />
(Rs. Crore)<br />
INSURER Life Non-Life Total<br />
<strong>2008</strong> 20<strong>09</strong> <strong>2008</strong> 20<strong>09</strong> <strong>2008</strong> 20<strong>09</strong><br />
Public 678403 799593 47216 47782 725619 847375<br />
(21.32) (17.86) (6.89) (1.20) (20.26) (16.78)<br />
Private 87567 116772 9064 11111 96630 127883<br />
(94.68) (33.35) (45.91) (22.59) (88.76) (32.34)<br />
Total 765969 916365 56280 58893 822249 975258<br />
(26.78) (19.63) (11.70) (4.64) (25.62) (18.61)<br />
Note: Figure in brackets represents growth in per cent over the previous year.<br />
(b) Investments of Life Insurers<br />
Instrument wise investments<br />
Investments in Central government securities have<br />
come down to 42.50 per cent as on 31 st March 20<strong>09</strong><br />
from 46.88 per cent as on 31 st March <strong>2008</strong>. Similarly,<br />
investments in Housing and Infrastructure decreased<br />
from 10 per cent to 8.97 per cent. On the other hand,<br />
‘Approved Investments’ have gone up from 22.99 per<br />
cent on 31 st March <strong>2008</strong> to 27.23 per cent on 31 st<br />
March 20<strong>09</strong>.<br />
TABLE 36 (I)<br />
TOTAL INVESTMENTS OF LIFE INSURERS: INSTRUMENT-WISE<br />
(Rs. Crore)<br />
Investments from 31 st March <strong>2008</strong> 31 st March 20<strong>09</strong><br />
Amount Percentage Amount Percentage<br />
Traditional Products<br />
1 Central govt. securities 296687.46 46.88 3160<strong>09</strong>.75 42.50<br />
2 State govt. and other approved securities 85198.11 13.46 107189.59 14.41<br />
3 Housing & Infrastructure 63262.13 10.00 66673.33 8.97<br />
4 Approved Investments 145553.71 22.99 202468.97 27.23<br />
5 Other Investments 42190.44 6.67 51260.39 6.89<br />
A. Total (1+2+3+4+5) 632891.85 100.00 743602.02 100.00<br />
ULIP Funds<br />
6. Approved Investments 111629.43 83.88 151489.89 87.69<br />
7 Other Investments 21448.05 16.12 21272.87 12.31<br />
B. Total (6+7) 133077.48 100.00 172762.76 100.00<br />
Grand Total (A+B) 765969.33 916364.78<br />
30