Railway safety performance in the European Union
Railway safety performance in the European Union
Railway safety performance in the European Union

You also want an ePaper? Increase the reach of your titles
YUMPU automatically turns print PDFs into web optimized ePapers that Google loves.
.<br />
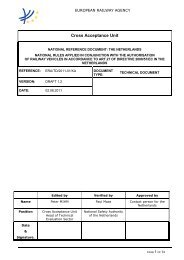
Figure 11: Percentage of level cross<strong>in</strong>gs with automatic or manual protection (2007–2009)<br />
100 %<br />
90 %<br />
80 %<br />
70 %<br />
60 %<br />
50 %<br />
40 %<br />
30 %<br />
20 %<br />
0.28<br />
0.29<br />
0.3<br />
0.81<br />
081<br />
0.81<br />
042 0.42<br />
0.57<br />
0.58<br />
0.25<br />
0.25<br />
0.25<br />
0.57<br />
0.59<br />
0.58<br />
0.57<br />
0.55<br />
0.56<br />
0.47<br />
0.49<br />
0.5<br />
066<br />
0.66<br />
0.72<br />
056 0.56<br />
0.35<br />
035<br />
0.35<br />
0.39<br />
0.19<br />
0.2<br />
0.21<br />
0.73<br />
0.59<br />
0.59<br />
0.59<br />
0.19<br />
0.2<br />
0.21 0.82<br />
0.83<br />
0.74<br />
0.75<br />
0.73<br />
0.75<br />
0.64<br />
0.6 06<br />
0.6<br />
068 0.68<br />
0.76<br />
0.77<br />
0.34<br />
034<br />
0.34<br />
0.39<br />
0.38<br />
0.37<br />
0.4<br />
0.31<br />
0.29<br />
0.33<br />
0.31<br />
03<br />
0.22<br />
0.35<br />
033<br />
0.33<br />
0.38<br />
0.47<br />
0.49<br />
0.48<br />
0.24<br />
0.25<br />
0.24<br />
10 %<br />
0 %<br />
AT BE BG CT CZ DE DK EE EL ES FI FR HU IE IT LT LU LV NL NO PL PT RO SE SI SK UK<br />
• 2007 • 2008 • 2009<br />
Traffic volumes<br />
There are two measures of rail traffic <strong>performance</strong> that are available for statistical purposes. The number of passengerkilometres<br />
and <strong>the</strong> number of tra<strong>in</strong>-kilometres. While <strong>the</strong> number of passenger-km at <strong>the</strong> EU level has rema<strong>in</strong>ed constant<br />
over <strong>the</strong> past three years, <strong>the</strong> number of tra<strong>in</strong>-km dropped by 3 % <strong>in</strong> 2009 <strong>in</strong> comparison with 2008, most likely as a<br />
result of <strong>the</strong> economic crisis.<br />
Four countries with <strong>the</strong> highest passenger volumes (Germany, France, Italy and <strong>the</strong> UK) alone account for two thirds of<br />
all passenger-km ( 10 ). Only Belgium, France, <strong>the</strong> Ne<strong>the</strong>rlands and Portugal managed to susta<strong>in</strong> growth <strong>in</strong> rail passenger<br />
volume over <strong>the</strong> past three years. In Figure 13, <strong>the</strong> total number of tra<strong>in</strong>-km — both freight and passenger tra<strong>in</strong>-km<br />
comb<strong>in</strong>ed — is shown. This should be kept <strong>in</strong> m<strong>in</strong>d when compar<strong>in</strong>g values shown <strong>in</strong> Figures 12 and 13.<br />
( 10 ) Exact value for 2009 is 67 % (exclud<strong>in</strong>g Channel Tunnel).<br />
26