94 <strong>Denbury</strong> <strong>Resources</strong> Inc. <strong>2009</strong> <strong>Annual</strong> <strong>Report</strong>Note 9. Stock Compensation PlansStock Incentive Plans<strong>Denbury</strong> has two stock compensation plans. The first plan has been in existence since 1995 (the “1995 Plan”) andexpired in August 2005 (although options granted under the 1995 Plan prior to that time can remain outstanding for up to10 years). The 1995 Plan only provided for the issuance of stock options, and in January 2005, we issued stock optionsunder the 1995 Plan that utilized substantially all of the remaining authorized shares. The second plan, the 2004 OmnibusStock and Incentive Plan (the “2004 Plan”), has a 10-year term and was approved by the stockholders in May 2004. InMay 2007, shareholders approved an increase to the number of shares that may be used under our 2004 Plan, from 10.0million to 14.0 million shares. In May <strong>2009</strong>, the shareholders approved an additional increase from 14.0 million to 21.5 millionshares. The 2004 Plan provides for the issuance of incentive and non-qualified stock options, restricted stock awards,stock appreciation rights (“SARs”) settled in stock, and performance awards that may be issued to officers, employees,directors and consultants. Awards covering a total of 21.5 million shares of common stock are authorized for issuancepursuant to the 2004 Plan, of which awards covering no more than 14.2 million shares may be issued in the form ofrestricted stock or performance vesting awards. At December 31, <strong>2009</strong>, a total of 7,565,963 shares were available for futureissuance of awards, of which only 7,348,042 shares may be in the form of restricted stock or performance vesting awards.<strong>Denbury</strong> has historically granted incentive and non-qualified stock options to its employees. Effective January 1,2006, we completely replaced the use of stock options for employees with SARs settled in stock, as SARs are lessdilutive to our stockholders while providing an employee with essentially the same economic benefits as stock options.The stock options and SARs generally become exercisable over a four-year vesting period with the specific terms ofvesting determined at the time of grant based on guidelines established by the Board of Directors. The stock optionsand SARs expire over terms not to exceed 10 years from the date of grant, 90 days after termination of employment,and 90 days or one year after permanent disability, depending on the plan, or one year after the death of the optionee.The stock options and SARs are granted at the fair market value at the time of grant, which is defined in the 2004Plan as the closing price on the NYSE on the date of grant. The plan is administered by the Compensation Committeeof <strong>Denbury</strong>’s Board of Directors.In 2004, <strong>Denbury</strong> began the use of restricted stock awards for its officers and independent directors, all grantedunder the 2004 Plan. The holders of these shares have all of the rights and privileges of owning the shares (includingvoting rights) except that the holders are not entitled to delivery of a portion thereof until certain requirements are met.With respect to the restricted stock granted to officers of <strong>Denbury</strong> in 2004, the vesting restrictions on those shares areas follows: i) 65% of the awards vest 20% per year over five years, and ii) 35% of the awards vest upon retirement, asdefined in the 2004 Plan. On January 30, <strong>2009</strong>, the Board of Directors modified the vesting provisions for the 35% ofthe awards that would vest upon retirement to now vest ratably each January 31 (beginning January 31, <strong>2009</strong>) untilthe final vesting on the retirement eligibility date.Total stock-based compensation expense was $21.9 million, $14.1 million and $10.6 million for the years endedDecember 31, <strong>2009</strong>, 2008 and 2007, respectively. Part of this expense, $1.4 million in <strong>2009</strong>, $1.4 million in 2008 and$1.5 million in 2007, was included in “Lease operating expenses” for stock compensation expense associated with ourfield employees, and the remaining amount recognized in “General and administrative expenses” in the ConsolidatedStatements of Operations. The total income tax benefit recognized in the Consolidated Statements of Operations forshare-based compensation arrangements was $8.7 million, $5.3 million and $4.1 million for the years ended December31, <strong>2009</strong>, 2008 and 2007, respectively. Share-based compensation associated with our employees involved in explorationand drilling activities of $2.5 million, $2.2 million and $1.6 million for the years ended December 31, <strong>2009</strong>, 2008 and 2007,respectively, has been capitalized as part of “Oil and natural gas properties” in the Consolidated Balance Sheets.Stock Options and SARsThe fair value of each SAR award is estimated on the date of grant using the Black-Scholes option pricing modelwith the assumptions noted in the following table. The risk-free rate for periods within the contractual life of the option isbased on the U.S. Treasury yield curve in effect at the time of grant. The expected life of stock options and SARsgranted was derived from examination of our historical option grants and subsequent exercises. The contractual terms(4-year cliff vesting and 4-year graded vesting) are evaluated separately for the expected life, as the exercise behaviorForm 10-K Part IINotes to Consolidated Financial Statements
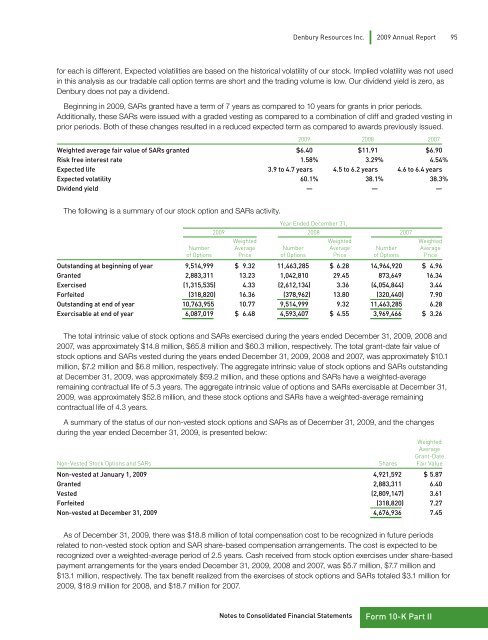
<strong>Denbury</strong> <strong>Resources</strong> Inc. <strong>2009</strong> <strong>Annual</strong> <strong>Report</strong> 95for each is different. Expected volatilities are based on the historical volatility of our stock. Implied volatility was not usedin this analysis as our tradable call option terms are short and the trading volume is low. Our dividend yield is zero, as<strong>Denbury</strong> does not pay a dividend.Beginning in <strong>2009</strong>, SARs granted have a term of 7 years as compared to 10 years for grants in prior periods.Additionally, these SARs were issued with a graded vesting as compared to a combination of cliff and graded vesting inprior periods. Both of these changes resulted in a reduced expected term as compared to awards previously issued.<strong>2009</strong> 2008 2007Weighted average fair value of SARs granted $6.40 $11.91 $6.90Risk free interest rate 1.58% 3.29% 4.54%Expected life 3.9 to 4.7 years 4.5 to 6.2 years 4.6 to 6.4 yearsExpected volatility 60.1% 38.1% 38.3%Dividend yield — — —The following is a summary of our stock option and SARs activity.Year Ended December 31,<strong>2009</strong> 2008 2007Weighted Weighted WeightedNumber Average Number Average Number Averageof Options Price of Options Price of Options PriceOutstanding at beginning of year 9,514,999 $ 9.32 11,463,285 $ 6.28 14,964,920 $ 4.96Granted 2,883,311 13.23 1,042,810 29.45 873,649 16.34Exercised (1,315,535) 4.33 (2,612,134) 3.36 (4,054,844) 3.44Forfeited (318,820) 16.36 (378,962) 13.80 (320,440) 7.90Outstanding at end of year 10,763,955 10.77 9,514,999 9.32 11,463,285 6.28Exercisable at end of year 6,087,019 $ 6.48 4,593,407 $ 4.55 3,969,466 $ 3.26The total intrinsic value of stock options and SARs exercised during the years ended December 31, <strong>2009</strong>, 2008 and2007, was approximately $14.8 million, $65.8 million and $60.3 million, respectively. The total grant-date fair value ofstock options and SARs vested during the years ended December 31, <strong>2009</strong>, 2008 and 2007, was approximately $10.1million, $7.2 million and $6.8 million, respectively. The aggregate intrinsic value of stock options and SARs outstandingat December 31, <strong>2009</strong>, was approximately $59.2 million, and these options and SARs have a weighted-averageremaining contractual life of 5.3 years. The aggregate intrinsic value of options and SARs exercisable at December 31,<strong>2009</strong>, was approximately $52.8 million, and these stock options and SARs have a weighted-average remainingcontractual life of 4.3 years.A summary of the status of our non-vested stock options and SARs as of December 31, <strong>2009</strong>, and the changesduring the year ended December 31, <strong>2009</strong>, is presented below:WeightedAverageGrant-DateNon-Vested Stock Options and SARs Shares Fair ValueNon-vested at January 1, <strong>2009</strong> 4,921,592 $ 5.87Granted 2,883,311 6.40Vested (2,809,147) 3.61Forfeited (318,820) 7.27Non-vested at December 31, <strong>2009</strong> 4,676,936 7.45As of December 31, <strong>2009</strong>, there was $18.8 million of total compensation cost to be recognized in future periodsrelated to non-vested stock option and SAR share-based compensation arrangements. The cost is expected to berecognized over a weighted-average period of 2.5 years. Cash received from stock option exercises under share-basedpayment arrangements for the years ended December 31, <strong>2009</strong>, 2008 and 2007, was $5.7 million, $7.7 million and$13.1 million, respectively. The tax benefit realized from the exercises of stock options and SARs totaled $3.1 million for<strong>2009</strong>, $18.9 million for 2008, and $18.7 million for 2007.Notes to Consolidated Financial StatementsForm 10-K Part II


