

Interactive 2009 Annual Report (PDF 7.56 MB) - Denbury Resources ...
Interactive 2009 Annual Report (PDF 7.56 MB) - Denbury Resources ...
Interactive 2009 Annual Report (PDF 7.56 MB) - Denbury Resources ...
- No tags were found...

Create successful ePaper yourself
Turn your PDF publications into a flip-book with our unique Google optimized e-Paper software.
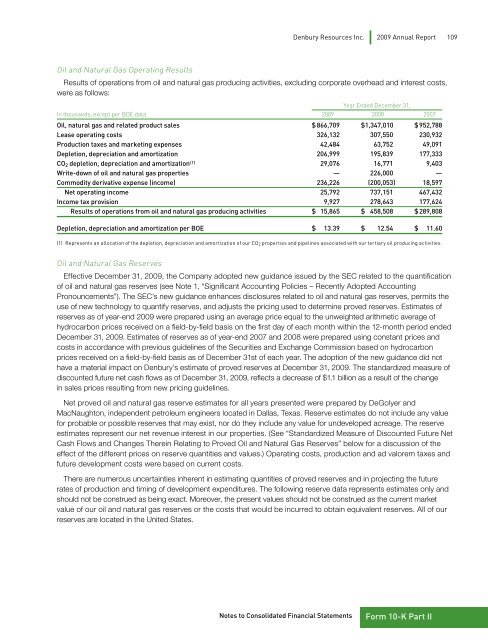
<strong>Denbury</strong> <strong>Resources</strong> Inc. <strong>2009</strong> <strong>Annual</strong> <strong>Report</strong> 109Oil and Natural Gas Operating ResultsResults of operations from oil and natural gas producing activities, excluding corporate overhead and interest costs,were as follows:Year Ended December 31,In thousands, except per BOE data <strong>2009</strong> 2008 2007Oil, natural gas and related product sales $ 866,709 $ 1,347,010 $ 952,788Lease operating costs 326,132 307,550 230,932Production taxes and marketing expenses 42,484 63,752 49,091Depletion, depreciation and amortization 206,999 195,839 177,333CO 2 depletion, depreciation and amortization (1) 29,076 16,771 9,403Write-down of oil and natural gas properties — 226,000 —Commodity derivative expense (income) 236,226 (200,053) 18,597Net operating income 25,792 737,151 467,432Income tax provision 9,927 278,643 177,624Results of operations from oil and natural gas producing activities $ 15,865 $ 458,508 $ 289,808Depletion, depreciation and amortization per BOE $ 13.39 $ 12.54 $ 11.60(1) Represents an allocation of the depletion, depreciation and amortization of our CO 2 properties and pipelines associated with our tertiary oil producing activities.Oil and Natural Gas ReservesEffective December 31, <strong>2009</strong>, the Company adopted new guidance issued by the SEC related to the quantificationof oil and natural gas reserves (see Note 1, “Significant Accounting Policies – Recently Adopted AccountingPronouncements”). The SEC’s new guidance enhances disclosures related to oil and natural gas reserves, permits theuse of new technology to quantify reserves, and adjusts the pricing used to determine proved reserves. Estimates ofreserves as of year-end <strong>2009</strong> were prepared using an average price equal to the unweighted arithmetic average ofhydrocarbon prices received on a field-by-field basis on the first day of each month within the 12-month period endedDecember 31, <strong>2009</strong>. Estimates of reserves as of year-end 2007 and 2008 were prepared using constant prices andcosts in accordance with previous guidelines of the Securities and Exchange Commission based on hydrocarbonprices received on a field-by-field basis as of December 31st of each year. The adoption of the new guidance did nothave a material impact on <strong>Denbury</strong>’s estimate of proved reserves at December 31, <strong>2009</strong>. The standardized measure ofdiscounted future net cash flows as of December 31, <strong>2009</strong>, reflects a decrease of $1.1 billion as a result of the changein sales prices resulting from new pricing guidelines.Net proved oil and natural gas reserve estimates for all years presented were prepared by DeGolyer andMacNaughton, independent petroleum engineers located in Dallas, Texas. Reserve estimates do not include any valuefor probable or possible reserves that may exist, nor do they include any value for undeveloped acreage. The reserveestimates represent our net revenue interest in our properties. (See “Standardized Measure of Discounted Future NetCash Flows and Changes Therein Relating to Proved Oil and Natural Gas Reserves” below for a discussion of theeffect of the different prices on reserve quantities and values.) Operating costs, production and ad valorem taxes andfuture development costs were based on current costs.There are numerous uncertainties inherent in estimating quantities of proved reserves and in projecting the futurerates of production and timing of development expenditures. The following reserve data represents estimates only andshould not be construed as being exact. Moreover, the present values should not be construed as the current marketvalue of our oil and natural gas reserves or the costs that would be incurred to obtain equivalent reserves. All of ourreserves are located in the United States.Notes to Consolidated Financial StatementsForm 10-K Part II

