

Interactive 2009 Annual Report (PDF 7.56 MB) - Denbury Resources ...
Interactive 2009 Annual Report (PDF 7.56 MB) - Denbury Resources ...
Interactive 2009 Annual Report (PDF 7.56 MB) - Denbury Resources ...
- No tags were found...

Create successful ePaper yourself
Turn your PDF publications into a flip-book with our unique Google optimized e-Paper software.
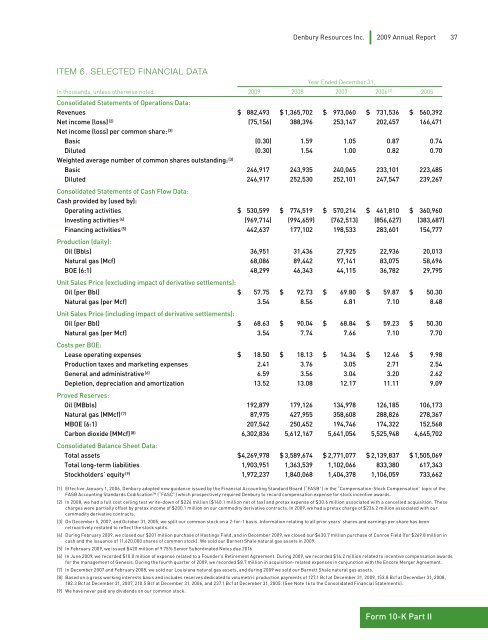
<strong>Denbury</strong> <strong>Resources</strong> Inc. <strong>2009</strong> <strong>Annual</strong> <strong>Report</strong> 37Item 6. Selected Financial DataYear Ended December 31,In thousands, unless otherwise noted <strong>2009</strong> 2008 2007 2006 (1) 2005Consolidated Statements of Operations Data:Revenues $ 882,493 $ 1,365,702 $ 973,060 $ 731,536 $ 560,392Net income (loss) (2) (75,156) 388,396 253,147 202,457 166,471Net income (loss) per common share: (3)Basic (0.30) 1.59 1.05 0.87 0.74Diluted (0.30) 1.54 1.00 0.82 0.70Weighted average number of common shares outstanding: (3)Basic 246,917 243,935 240,065 233,101 223,485Diluted 246,917 252,530 252,101 247,547 239,267Consolidated Statements of Cash Flow Data:Cash provided by (used by):Operating activities $ 530,599 $ 774,519 $ 570,214 $ 461,810 $ 360,960Investing activities (4) (969,714) (994,659) (762,513) (856,627) (383,687)Financing activities (5) 442,637 177,102 198,533 283,601 154,777Production (daily):Oil (Bbls) 36,951 31,436 27,925 22,936 20,013Natural gas (Mcf) 68,086 89,442 97,141 83,075 58,696BOE (6:1) 48,299 46,343 44,115 36,782 29,795Unit Sales Price (excluding impact of derivative settlements):Oil (per Bbl) $ 57.75 $ 92.73 $ 69.80 $ 59.87 $ 50.30Natural gas (per Mcf) 3.54 8.56 6.81 7.10 8.48Unit Sales Price (including impact of derivative settlements):Oil (per Bbl) $ 68.63 $ 90.04 $ 68.84 $ 59.23 $ 50.30Natural gas (per Mcf) 3.54 7.74 7.66 7.10 7.70Costs per BOE:Lease operating expenses $ 18.50 $ 18.13 $ 14.34 $ 12.46 $ 9.98Production taxes and marketing expenses 2.41 3.76 3.05 2.71 2.54General and administrative (6) 6.59 3.56 3.04 3.20 2.62Depletion, depreciation and amortization 13.52 13.08 12.17 11.11 9.09Proved Reserves:Oil (<strong>MB</strong>bls) 192,879 179,126 134,978 126,185 106,173Natural gas (MMcf) (7) 87,975 427,955 358,608 288,826 278,367<strong>MB</strong>OE (6:1) 207,542 250,452 194,746 174,322 152,568Carbon dioxide (MMcf) (8) 6,302,836 5,612,167 5,641,054 5,525,948 4,645,702Consolidated Balance Sheet Data:Total assets $ 4,269,978 $ 3,589,674 $ 2,771,077 $ 2,139,837 $ 1,505,069Total long-term liabilities 1,903,951 1,363,539 1,102,066 833,380 617,343Stockholders’ equity (9) 1,972,237 1,840,068 1,404,378 1,106,059 733,662(1) Effective January 1, 2006, <strong>Denbury</strong> adopted new guidance issued by the Financial Accounting Standard Board (“FASB”) in the “Compensation-Stock Compensation” topic of theFASB Accounting Standards Codification TM (“FASC”) which prospectively required <strong>Denbury</strong> to record compensation expense for stock incentive awards.(2) In 2008, we had a full cost ceiling test write-down of $226 million ($140.1 million net of tax) and pretax expense of $30.6 million associated with a cancelled acquisition. Thesecharges were partially offset by pretax income of $200.1 million on our commodity derivative contracts. In <strong>2009</strong>, we had a pretax charge of $236.2 million associated with ourcommodity derivative contracts.(3) On December 5, 2007, and October 31, 2005, we split our common stock on a 2-for-1 basis. Information relating to all prior years’ shares and earnings per share has beenretroactively restated to reflect the stock splits.(4) During February <strong>2009</strong>, we closed our $201 million purchase of Hastings Field, and in December <strong>2009</strong>, we closed our $430.7 million purchase of Conroe Field (for $269.8 million incash and the issuance of 11,620,000 shares of common stock). We sold our Barnett Shale natural gas assets in <strong>2009</strong>.(5) In February <strong>2009</strong>, we issued $420 million of 9.75% Senior Subordinated Notes due 2016.(6) In June <strong>2009</strong>, we recorded $10.0 million of expense related to a Founder’s Retirement Agreement. During <strong>2009</strong>, we recorded $14.2 million related to incentive compensation awardsfor the management of Genesis. During the fourth quarter of <strong>2009</strong>, we recorded $8.7 million in acquisition-related expenses in conjunction with the Encore Merger Agreement.(7) In December 2007 and February 2008, we sold our Louisiana natural gas assets, and during <strong>2009</strong> we sold our Barnett Shale natural gas assets.(8) Based on a gross working interests basis and includes reserves dedicated to volumetric production payments of 127.1 Bcf at December 31, <strong>2009</strong>, 153.8 Bcf at December 31, 2008,182.3 Bcf at December 31, 2007, 210.5 Bcf at December 31, 2006, and 237.1 Bcf at December 31, 2005. (See Note 16 to the Consolidated Financial Statements).(9) We have never paid any dividends on our common stock.Form 10-K Part II

