

Interactive 2009 Annual Report (PDF 7.56 MB) - Denbury Resources ...
Interactive 2009 Annual Report (PDF 7.56 MB) - Denbury Resources ...
Interactive 2009 Annual Report (PDF 7.56 MB) - Denbury Resources ...
- No tags were found...

You also want an ePaper? Increase the reach of your titles
YUMPU automatically turns print PDFs into web optimized ePapers that Google loves.
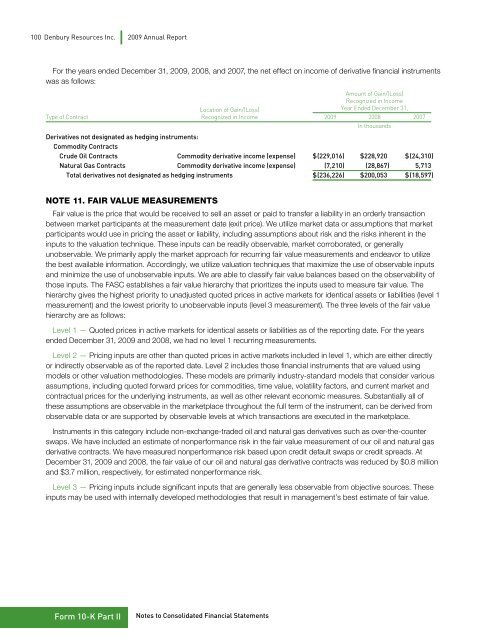
100 <strong>Denbury</strong> <strong>Resources</strong> Inc. <strong>2009</strong> <strong>Annual</strong> <strong>Report</strong>For the years ended December 31, <strong>2009</strong>, 2008, and 2007, the net effect on income of derivative financial instrumentswas as follows:Amount of Gain/(Loss)Recognized in IncomeLocation of Gain/(Loss) Year Ended December 31,Type of Contract Recognized in Income <strong>2009</strong> 2008 2007In thousandsDerivatives not designated as hedging instruments:Commodity ContractsCrude Oil Contracts Commodity derivative income (expense) $ (229,016) $ 228,920 $ (24,310)Natural Gas Contracts Commodity derivative income (expense) (7,210) (28,867) 5,713Total derivatives not designated as hedging instruments $ (236,226) $ 200,053 $ (18,597)Note 11. Fair Value MeasurementsFair value is the price that would be received to sell an asset or paid to transfer a liability in an orderly transactionbetween market participants at the measurement date (exit price). We utilize market data or assumptions that marketparticipants would use in pricing the asset or liability, including assumptions about risk and the risks inherent in theinputs to the valuation technique. These inputs can be readily observable, market corroborated, or generallyunobservable. We primarily apply the market approach for recurring fair value measurements and endeavor to utilizethe best available information. Accordingly, we utilize valuation techniques that maximize the use of observable inputsand minimize the use of unobservable inputs. We are able to classify fair value balances based on the observability ofthose inputs. The FASC establishes a fair value hierarchy that prioritizes the inputs used to measure fair value. Thehierarchy gives the highest priority to unadjusted quoted prices in active markets for identical assets or liabilities (level 1measurement) and the lowest priority to unobservable inputs (level 3 measurement). The three levels of the fair valuehierarchy are as follows:Level 1 — Quoted prices in active markets for identical assets or liabilities as of the reporting date. For the yearsended December 31, <strong>2009</strong> and 2008, we had no level 1 recurring measurements.Level 2 — Pricing inputs are other than quoted prices in active markets included in level 1, which are either directlyor indirectly observable as of the reported date. Level 2 includes those financial instruments that are valued usingmodels or other valuation methodologies. These models are primarily industry-standard models that consider variousassumptions, including quoted forward prices for commodities, time value, volatility factors, and current market andcontractual prices for the underlying instruments, as well as other relevant economic measures. Substantially all ofthese assumptions are observable in the marketplace throughout the full term of the instrument, can be derived fromobservable data or are supported by observable levels at which transactions are executed in the marketplace.Instruments in this category include non-exchange-traded oil and natural gas derivatives such as over-the-counterswaps. We have included an estimate of nonperformance risk in the fair value measurement of our oil and natural gasderivative contracts. We have measured nonperformance risk based upon credit default swaps or credit spreads. AtDecember 31, <strong>2009</strong> and 2008, the fair value of our oil and natural gas derivative contracts was reduced by $0.8 millionand $3.7 million, respectively, for estimated nonperformance risk.Level 3 — Pricing inputs include significant inputs that are generally less observable from objective sources. Theseinputs may be used with internally developed methodologies that result in management’s best estimate of fair value.Form 10-K Part IINotes to Consolidated Financial Statements

