

Interactive 2009 Annual Report (PDF 7.56 MB) - Denbury Resources ...
Interactive 2009 Annual Report (PDF 7.56 MB) - Denbury Resources ...
Interactive 2009 Annual Report (PDF 7.56 MB) - Denbury Resources ...
- No tags were found...

You also want an ePaper? Increase the reach of your titles
YUMPU automatically turns print PDFs into web optimized ePapers that Google loves.
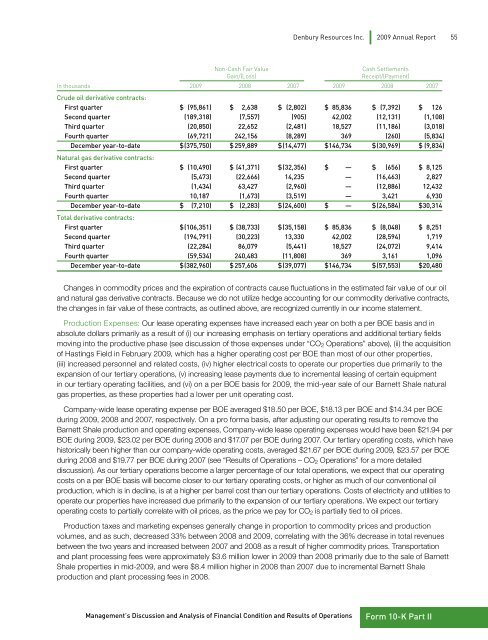
<strong>Denbury</strong> <strong>Resources</strong> Inc. <strong>2009</strong> <strong>Annual</strong> <strong>Report</strong> 55Non-Cash Fair ValueGain/(Loss)Cash SettlementsReceipt/(Payment)In thousands <strong>2009</strong> 2008 2007 <strong>2009</strong> 2008 2007Crude oil derivative contracts:First quarter $ (95,861) $ 2,638 $ (2,802) $ 85,836 $ (7,392) $ 126Second quarter (189,318) (7,557) (905) 42,002 (12,131) (1,108)Third quarter (20,850) 22,652 (2,481) 18,527 (11,186) (3,018)Fourth quarter (69,721) 242,156 (8,289) 369 (260) (5,834)December year-to-date $ (375,750) $ 259,889 $ (14,477) $ 146,734 $ (30,969) $ (9,834)Natural gas derivative contracts:First quarter $ (10,490) $ (41,371) $ (32,356) $ — $ (656) $ 8,125Second quarter (5,473) (22,666) 14,235 — (16,463) 2,827Third quarter (1,434) 63,427 (2,960) — (12,886) 12,432Fourth quarter 10,187 (1,673) (3,519) — 3,421 6,930December year-to-date $ (7,210) $ (2,283) $ (24,600) $ — $ (26,584) $ 30,314Total derivative contracts:First quarter $ (106,351) $ (38,733) $ (35,158) $ 85,836 $ (8,048) $ 8,251Second quarter (194,791) (30,223) 13,330 42,002 (28,594) 1,719Third quarter (22,284) 86,079 (5,441) 18,527 (24,072) 9,414Fourth quarter (59,534) 240,483 (11,808) 369 3,161 1,096December year-to-date $ (382,960) $ 257,606 $ (39,077) $ 146,734 $ (57,553) $ 20,480Changes in commodity prices and the expiration of contracts cause fluctuations in the estimated fair value of our oiland natural gas derivative contracts. Because we do not utilize hedge accounting for our commodity derivative contracts,the changes in fair value of these contracts, as outlined above, are recognized currently in our income statement.Production Expenses: Our lease operating expenses have increased each year on both a per BOE basis and inabsolute dollars primarily as a result of (i) our increasing emphasis on tertiary operations and additional tertiary fieldsmoving into the productive phase (see discussion of those expenses under “CO 2 Operations” above), (ii) the acquisitionof Hastings Field in February <strong>2009</strong>, which has a higher operating cost per BOE than most of our other properties,(iii) increased personnel and related costs, (iv) higher electrical costs to operate our properties due primarily to theexpansion of our tertiary operations, (v) increasing lease payments due to incremental leasing of certain equipmentin our tertiary operating facilities, and (vi) on a per BOE basis for <strong>2009</strong>, the mid-year sale of our Barnett Shale naturalgas properties, as these properties had a lower per unit operating cost.Company-wide lease operating expense per BOE averaged $18.50 per BOE, $18.13 per BOE and $14.34 per BOEduring <strong>2009</strong>, 2008 and 2007, respectively. On a pro forma basis, after adjusting our operating results to remove theBarnett Shale production and operating expenses, Company-wide lease operating expenses would have been $21.94 perBOE during <strong>2009</strong>, $23.02 per BOE during 2008 and $17.07 per BOE during 2007. Our tertiary operating costs, which havehistorically been higher than our company-wide operating costs, averaged $21.67 per BOE during <strong>2009</strong>, $23.57 per BOEduring 2008 and $19.77 per BOE during 2007 (see “Results of Operations – CO 2 Operations” for a more detaileddiscussion). As our tertiary operations become a larger percentage of our total operations, we expect that our operatingcosts on a per BOE basis will become closer to our tertiary operating costs, or higher as much of our conventional oilproduction, which is in decline, is at a higher per barrel cost than our tertiary operations. Costs of electricity and utilities tooperate our properties have increased due primarily to the expansion of our tertiary operations. We expect our tertiaryoperating costs to partially correlate with oil prices, as the price we pay for CO 2 is partially tied to oil prices.Production taxes and marketing expenses generally change in proportion to commodity prices and productionvolumes, and as such, decreased 33% between 2008 and <strong>2009</strong>, correlating with the 36% decrease in total revenuesbetween the two years and increased between 2007 and 2008 as a result of higher commodity prices. Transportationand plant processing fees were approximately $3.6 million lower in <strong>2009</strong> than 2008 primarily due to the sale of BarnettShale properties in mid-<strong>2009</strong>, and were $8.4 million higher in 2008 than 2007 due to incremental Barnett Shaleproduction and plant processing fees in 2008.Management’s Discussion and Analysis of Financial Condition and Results of OperationsForm 10-K Part II

