Calibration of Seismic Attributes for Reservoir Characterization ...
Calibration of Seismic Attributes for Reservoir Characterization ...
Calibration of Seismic Attributes for Reservoir Characterization ...

Create successful ePaper yourself
Turn your PDF publications into a flip-book with our unique Google optimized e-Paper software.
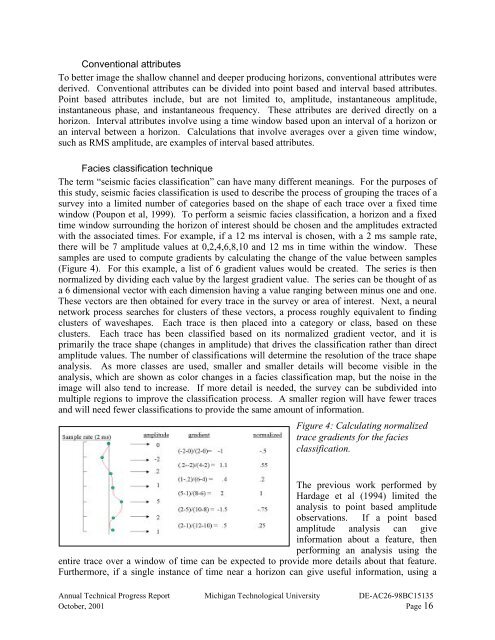
Conventional attributesTo better image the shallow channel and deeper producing horizons, conventional attributes werederived. Conventional attributes can be divided into point based and interval based attributes.Point based attributes include, but are not limited to, amplitude, instantaneous amplitude,instantaneous phase, and instantaneous frequency. These attributes are derived directly on ahorizon. Interval attributes involve using a time window based upon an interval <strong>of</strong> a horizon oran interval between a horizon. Calculations that involve averages over a given time window,such as RMS amplitude, are examples <strong>of</strong> interval based attributes.Facies classification techniqueThe term “seismic facies classification” can have many different meanings. For the purposes <strong>of</strong>this study, seismic facies classification is used to describe the process <strong>of</strong> grouping the traces <strong>of</strong> asurvey into a limited number <strong>of</strong> categories based on the shape <strong>of</strong> each trace over a fixed timewindow (Poupon et al, 1999). To per<strong>for</strong>m a seismic facies classification, a horizon and a fixedtime window surrounding the horizon <strong>of</strong> interest should be chosen and the amplitudes extractedwith the associated times. For example, if a 12 ms interval is chosen, with a 2 ms sample rate,there will be 7 amplitude values at 0,2,4,6,8,10 and 12 ms in time within the window. Thesesamples are used to compute gradients by calculating the change <strong>of</strong> the value between samples(Figure 4). For this example, a list <strong>of</strong> 6 gradient values would be created. The series is thennormalized by dividing each value by the largest gradient value. The series can be thought <strong>of</strong> asa 6 dimensional vector with each dimension having a value ranging between minus one and one.These vectors are then obtained <strong>for</strong> every trace in the survey or area <strong>of</strong> interest. Next, a neuralnetwork process searches <strong>for</strong> clusters <strong>of</strong> these vectors, a process roughly equivalent to findingclusters <strong>of</strong> waveshapes. Each trace is then placed into a category or class, based on theseclusters. Each trace has been classified based on its normalized gradient vector, and it isprimarily the trace shape (changes in amplitude) that drives the classification rather than directamplitude values. The number <strong>of</strong> classifications will determine the resolution <strong>of</strong> the trace shapeanalysis. As more classes are used, smaller and smaller details will become visible in theanalysis, which are shown as color changes in a facies classification map, but the noise in theimage will also tend to increase. If more detail is needed, the survey can be subdivided intomultiple regions to improve the classification process. A smaller region will have fewer tracesand will need fewer classifications to provide the same amount <strong>of</strong> in<strong>for</strong>mation.Figure 4: Calculating normalizedtrace gradients <strong>for</strong> the faciesclassification.The previous work per<strong>for</strong>med byHardage et al (1994) limited theanalysis to point based amplitudeobservations. If a point basedamplitude analysis can givein<strong>for</strong>mation about a feature, thenper<strong>for</strong>ming an analysis using theentire trace over a window <strong>of</strong> time can be expected to provide more details about that feature.Furthermore, if a single instance <strong>of</strong> time near a horizon can give useful in<strong>for</strong>mation, using aAnnual Technical Progress Report Michigan Technological University DE-AC26-98BC15135October, 2001 Page 16