Calibration of Seismic Attributes for Reservoir Characterization ...
Calibration of Seismic Attributes for Reservoir Characterization ...
Calibration of Seismic Attributes for Reservoir Characterization ...
You also want an ePaper? Increase the reach of your titles
YUMPU automatically turns print PDFs into web optimized ePapers that Google loves.
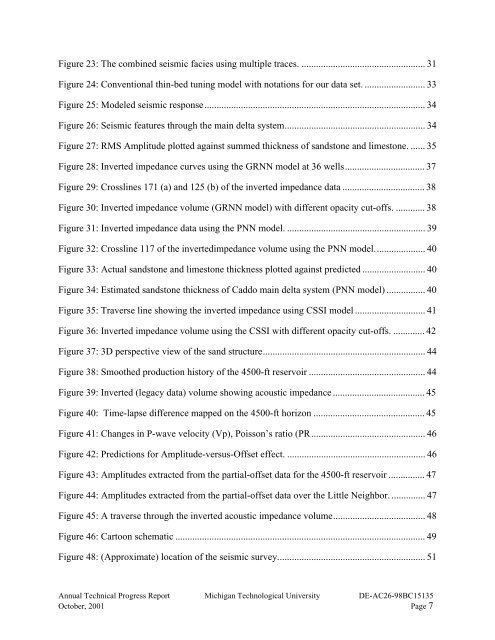
Figure 23: The combined seismic facies using multiple traces. ................................................... 31Figure 24: Conventional thin-bed tuning model with notations <strong>for</strong> our data set. ......................... 33Figure 25: Modeled seismic response........................................................................................... 34Figure 26: <strong>Seismic</strong> features through the main delta system.......................................................... 34Figure 27: RMS Amplitude plotted against summed thickness <strong>of</strong> sandstone and limestone. ...... 35Figure 28: Inverted impedance curves using the GRNN model at 36 wells................................. 37Figure 29: Crosslines 171 (a) and 125 (b) <strong>of</strong> the inverted impedance data .................................. 38Figure 30: Inverted impedance volume (GRNN model) with different opacity cut-<strong>of</strong>fs. ............ 38Figure 31: Inverted impedance data using the PNN model. ......................................................... 39Figure 32: Crossline 117 <strong>of</strong> the invertedimpedance volume using the PNN model..................... 40Figure 33: Actual sandstone and limestone thickness plotted against predicted .......................... 40Figure 34: Estimated sandstone thickness <strong>of</strong> Caddo main delta system (PNN model) ................ 40Figure 35: Traverse line showing the inverted impedance using CSSI model ............................. 41Figure 36: Inverted impedance volume using the CSSI with different opacity cut-<strong>of</strong>fs. ............. 42Figure 37: 3D perspective view <strong>of</strong> the sand structure................................................................... 44Figure 38: Smoothed production history <strong>of</strong> the 4500-ft reservoir ................................................ 44Figure 39: Inverted (legacy data) volume showing acoustic impedance ...................................... 45Figure 40: Time-lapse difference mapped on the 4500-ft horizon .............................................. 45Figure 41: Changes in P-wave velocity (Vp), Poisson’s ratio (PR............................................... 46Figure 42: Predictions <strong>for</strong> Amplitude-versus-Offset effect. ......................................................... 46Figure 43: Amplitudes extracted from the partial-<strong>of</strong>fset data <strong>for</strong> the 4500-ft reservoir ............... 47Figure 44: Amplitudes extracted from the partial-<strong>of</strong>fset data over the Little Neighbor. .............. 47Figure 45: A traverse through the inverted acoustic impedance volume...................................... 48Figure 46: Cartoon schematic ....................................................................................................... 49Figure 48: (Approximate) location <strong>of</strong> the seismic survey............................................................. 51Annual Technical Progress Report Michigan Technological University DE-AC26-98BC15135October, 2001 Page 7


