Calibration of Seismic Attributes for Reservoir Characterization ...
Calibration of Seismic Attributes for Reservoir Characterization ...
Calibration of Seismic Attributes for Reservoir Characterization ...

You also want an ePaper? Increase the reach of your titles
YUMPU automatically turns print PDFs into web optimized ePapers that Google loves.
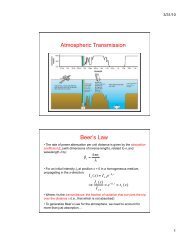
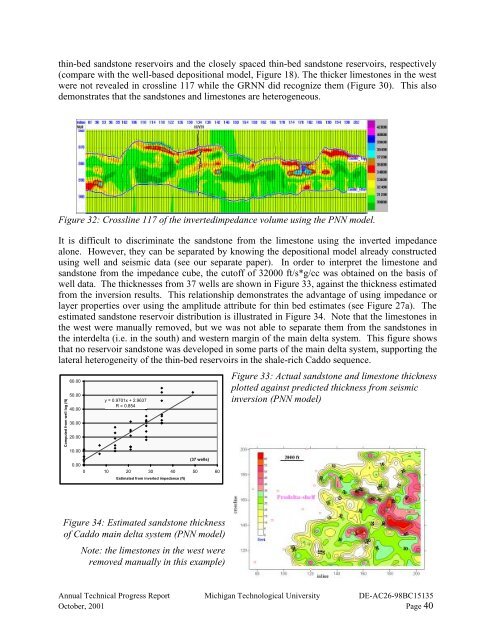
thin-bed sandstone reservoirs and the closely spaced thin-bed sandstone reservoirs, respectively(compare with the well-based depositional model, Figure 18). The thicker limestones in the westwere not revealed in crossline 117 while the GRNN did recognize them (Figure 30). This alsodemonstrates that the sandstones and limestones are heterogeneous.Figure 32: Crossline 117 <strong>of</strong> the invertedimpedance volume using the PNN model.It is difficult to discriminate the sandstone from the limestone using the inverted impedancealone. However, they can be separated by knowing the depositional model already constructedusing well and seismic data (see our separate paper). In order to interpret the limestone andsandstone from the impedance cube, the cut<strong>of</strong>f <strong>of</strong> 32000 ft/s*g/cc was obtained on the basis <strong>of</strong>well data. The thicknesses from 37 wells are shown in Figure 33, against the thickness estimatedfrom the inversion results. This relationship demonstrates the advantage <strong>of</strong> using impedance orlayer properties over using the amplitude attribute <strong>for</strong> thin bed estimates (see Figure 27a). Theestimated sandstone reservoir distribution is illustrated in Figure 34. Note that the limestones inthe west were manually removed, but we was not able to separate them from the sandstones inthe interdelta (i.e. in the south) and western margin <strong>of</strong> the main delta system. This figure showsthat no reservoir sandstone was developed in some parts <strong>of</strong> the main delta system, supporting thelateral heterogeneity <strong>of</strong> the thin-bed reservoirs in the shale-rich Caddo sequence.Computed from well log (ft)60.0050.0040.0030.0020.0010.00y = 0.9701x + 2.9637R = 0.854(37 wells)0.000 10 20 30 40 50 60Estimated from inverted impedance (ft)Figure 33: Actual sandstone and limestone thicknessplotted against predicted thickness from seismicinversion (PNN model)Figure 34: Estimated sandstone thickness<strong>of</strong> Caddo main delta system (PNN model)Note: the limestones in the west wereremoved manually in this example)Annual Technical Progress Report Michigan Technological University DE-AC26-98BC15135October, 2001 Page 40