Calibration of Seismic Attributes for Reservoir Characterization ...
Calibration of Seismic Attributes for Reservoir Characterization ...
Calibration of Seismic Attributes for Reservoir Characterization ...

Create successful ePaper yourself
Turn your PDF publications into a flip-book with our unique Google optimized e-Paper software.
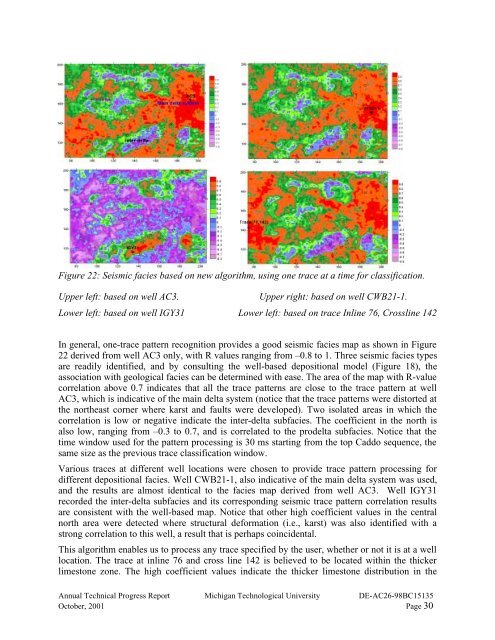
Figure 22: <strong>Seismic</strong> facies based on new algorithm, using one trace at a time <strong>for</strong> classification.Upper left: based on well AC3.Upper right: based on well CWB21-1.Lower left: based on well IGY31 Lower left: based on trace Inline 76, Crossline 142In general, one-trace pattern recognition provides a good seismic facies map as shown in Figure22 derived from well AC3 only, with R values ranging from –0.8 to 1. Three seismic facies typesare readily identified, and by consulting the well-based depositional model (Figure 18), theassociation with geological facies can be determined with ease. The area <strong>of</strong> the map with R-valuecorrelation above 0.7 indicates that all the trace patterns are close to the trace pattern at wellAC3, which is indicative <strong>of</strong> the main delta system (notice that the trace patterns were distorted atthe northeast corner where karst and faults were developed). Two isolated areas in which thecorrelation is low or negative indicate the inter-delta subfacies. The coefficient in the north isalso low, ranging from –0.3 to 0.7, and is correlated to the prodelta subfacies. Notice that thetime window used <strong>for</strong> the pattern processing is 30 ms starting from the top Caddo sequence, thesame size as the previous trace classification window.Various traces at different well locations were chosen to provide trace pattern processing <strong>for</strong>different depositional facies. Well CWB21-1, also indicative <strong>of</strong> the main delta system was used,and the results are almost identical to the facies map derived from well AC3. Well IGY31recorded the inter-delta subfacies and its corresponding seismic trace pattern correlation resultsare consistent with the well-based map. Notice that other high coefficient values in the centralnorth area were detected where structural de<strong>for</strong>mation (i.e., karst) was also identified with astrong correlation to this well, a result that is perhaps coincidental.This algorithm enables us to process any trace specified by the user, whether or not it is at a welllocation. The trace at inline 76 and cross line 142 is believed to be located within the thickerlimestone zone. The high coefficient values indicate the thicker limestone distribution in theAnnual Technical Progress Report Michigan Technological University DE-AC26-98BC15135October, 2001 Page 30