Download PDF - Rajasthan Rural Livelihoods Project
Download PDF - Rajasthan Rural Livelihoods Project
Download PDF - Rajasthan Rural Livelihoods Project

You also want an ePaper? Increase the reach of your titles
YUMPU automatically turns print PDFs into web optimized ePapers that Google loves.
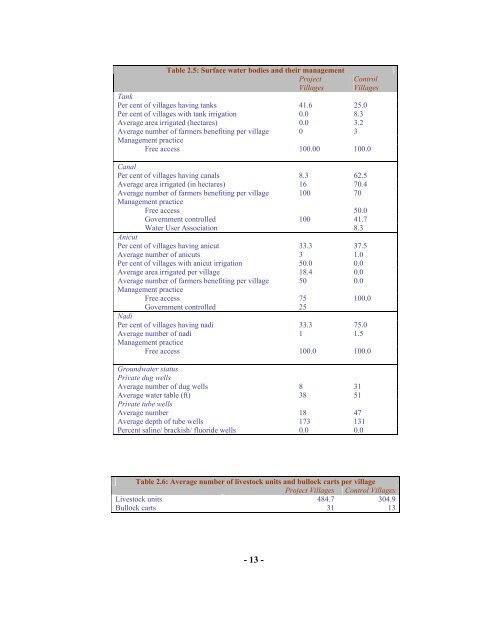
Table 2.5: Surface water bodies and their management<strong>Project</strong>VillagesControlVillagesTankPer cent of villages having tanks 41.6 25.0Per cent of villages with tank irrigation 0.0 8.3Average area irrigated (hectares) 0.0 3.2Average number of farmers benefiting per village 0 3Management practiceFree access 100.00 100.0CanalPer cent of villages having canals 8.3 62.5Average area irrigated (in hectares) 16 70.4Average number of farmers benefiting per village 100 70Management practiceFree access 50.0Government controlled 100 41.7Water User Association 8.3AnicutPer cent of villages having anicut 33.3 37.5Average number of anicuts 3 1.0Per cent of villages with anicut irrigation 50.0 0.0Average area irrigated per village 18.4 0.0Average number of farmers benefiting per village 50 0.0Management practiceFree access 75 100.0Government controlled 25NadiPer cent of villages having nadi 33.3 75.0Average number of nadi 1 1.5Management practiceFree access 100.0 100.0Groundwater statusPrivate dug wellsAverage number of dug wells 8 31Average water table (ft) 38 51Private tube wellsAverage number 18 47Average depth of tube wells 173 131Percent saline/ brackish/ fluoride wells 0.0 0.0Table 2.6: Average number of livestock units and bullock carts per village<strong>Project</strong> Villages Control VillagesLivestock units 484.7 304.9Bullock carts 31 13- 13 -