Download PDF - Rajasthan Rural Livelihoods Project
Download PDF - Rajasthan Rural Livelihoods Project
Download PDF - Rajasthan Rural Livelihoods Project

Create successful ePaper yourself
Turn your PDF publications into a flip-book with our unique Google optimized e-Paper software.
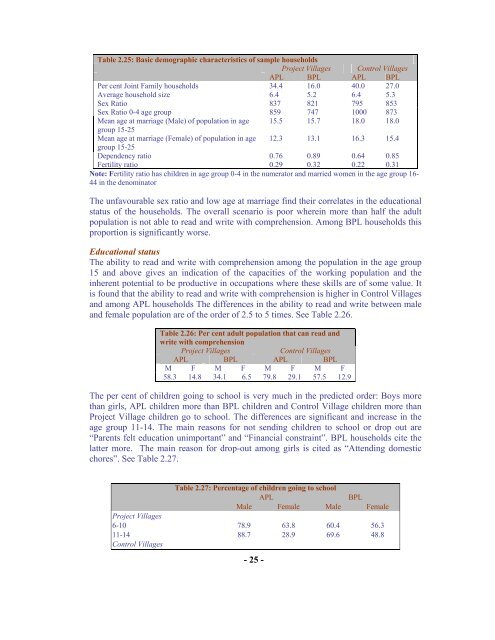
Table 2.25: Basic demographic characteristics of sample households<strong>Project</strong> Villages Control VillagesAPL BPL APL BPLPer cent Joint Family households 34.4 16.0 40.0 27.0Average household size 6.4 5.2 6.4 5.3Sex Ratio 837 821 795 853Sex Ratio 0-4 age group 859 747 1000 873Mean age at marriage (Male) of population in age 15.5 15.7 18.0 18.0group 15-25Mean age at marriage (Female) of population in age 12.3 13.1 16.3 15.4group 15-25Dependency ratio 0.76 0.89 0.64 0.85Fertility ratio 0.29 0.32 0.22 0.31Note: Fertility ratio has children in age group 0-4 in the numerator and married women in the age group 16-44 in the denominatorThe unfavourable sex ratio and low age at marriage find their correlates in the educationalstatus of the households. The overall scenario is poor wherein more than half the adultpopulation is not able to read and write with comprehension. Among BPL households thisproportion is significantly worse.Educational statusThe ability to read and write with comprehension among the population in the age group15 and above gives an indication of the capacities of the working population and theinherent potential to be productive in occupations where these skills are of some value. Itis found that the ability to read and write with comprehension is higher in Control Villagesand among APL households The differences in the ability to read and write between maleand female population are of the order of 2.5 to 5 times. See Table 2.26.Table 2.26: Per cent adult population that can read andwrite with comprehension<strong>Project</strong> VillagesControl VillagesAPL BPL APL BPLM F M F M F M F58.3 14.8 34.1 6.5 79.8 29.1 57.5 12.9The per cent of children going to school is very much in the predicted order: Boys morethan girls, APL children more than BPL children and Control Village children more than<strong>Project</strong> Village children go to school. The differences are significant and increase in theage group 11-14. The main reasons for not sending children to school or drop out are“Parents felt education unimportant” and “Financial constraint”. BPL households cite thelatter more. The main reason for drop-out among girls is cited as “Attending domesticchores”. See Table 2.27.Table 2.27: Percentage of children going to schoolAPLBPLMale Female Male Female<strong>Project</strong> Villages6-10 78.9 63.8 60.4 56.311-14 88.7 28.9 69.6 48.8Control Villages- 25 -