Download PDF - Rajasthan Rural Livelihoods Project
Download PDF - Rajasthan Rural Livelihoods Project
Download PDF - Rajasthan Rural Livelihoods Project

You also want an ePaper? Increase the reach of your titles
YUMPU automatically turns print PDFs into web optimized ePapers that Google loves.
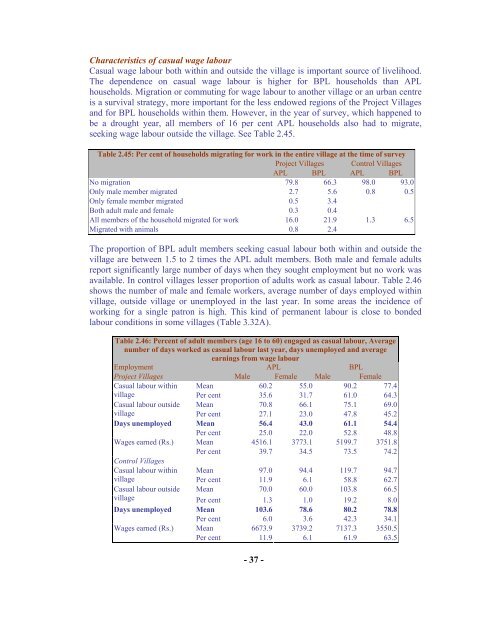
Characteristics of casual wage labourCasual wage labour both within and outside the village is important source of livelihood.The dependence on casual wage labour is higher for BPL households than APLhouseholds. Migration or commuting for wage labour to another village or an urban centreis a survival strategy, more important for the less endowed regions of the <strong>Project</strong> Villagesand for BPL households within them. However, in the year of survey, which happened tobe a drought year, all members of 16 per cent APL households also had to migrate,seeking wage labour outside the village. See Table 2.45.Table 2.45: Per cent of households migrating for work in the entire village at the time of survey<strong>Project</strong> Villages Control VillagesAPL BPL APL BPLNo migration 79.8 66.3 98.0 93.0Only male member migrated 2.7 5.6 0.8 0.5Only female member migrated 0.5 3.4Both adult male and female 0.3 0.4All members of the household migrated for work 16.0 21.9 1.3 6.5Migrated with animals 0.8 2.4The proportion of BPL adult members seeking casual labour both within and outside thevillage are between 1.5 to 2 times the APL adult members. Both male and female adultsreport significantly large number of days when they sought employment but no work wasavailable. In control villages lesser proportion of adults work as casual labour. Table 2.46shows the number of male and female workers, average number of days employed withinvillage, outside village or unemployed in the last year. In some areas the incidence ofworking for a single patron is high. This kind of permanent labour is close to bondedlabour conditions in some villages (Table 3.32A).Table 2.46: Percent of adult members (age 16 to 60) engaged as casual labour, Averagenumber of days worked as casual labour last year, days unemployed and averageearnings from wage labourEmployment APL BPL<strong>Project</strong> Villages Male Female Male FemaleCasual labour within Mean 60.2 55.0 90.2 77.4village Per cent 35.6 31.7 61.0 64.3Casual labour outside Mean 70.8 66.1 75.1 69.0village Per cent 27.1 23.0 47.8 45.2Days unemployed Mean 56.4 43.0 61.1 54.4Per cent 25.0 22.0 52.8 48.8Wages earned (Rs.) Mean 4516.1 3773.1 5199.7 3751.8Per cent 39.7 34.5 73.5 74.2Control VillagesCasual labour within Mean 97.0 94.4 119.7 94.7village Per cent 11.9 6.1 58.8 62.7Casual labour outside Mean 70.0 60.0 103.8 66.5village Per cent 1.3 1.0 19.2 8.0Days unemployed Mean 103.6 78.6 80.2 78.8Per cent 6.0 3.6 42.3 34.1Wages earned (Rs.) Mean 6673.9 3739.2 7137.3 3550.5Per cent 11.9 6.1 61.9 63.5- 37 -