Download PDF - Rajasthan Rural Livelihoods Project
Download PDF - Rajasthan Rural Livelihoods Project
Download PDF - Rajasthan Rural Livelihoods Project

Create successful ePaper yourself
Turn your PDF publications into a flip-book with our unique Google optimized e-Paper software.
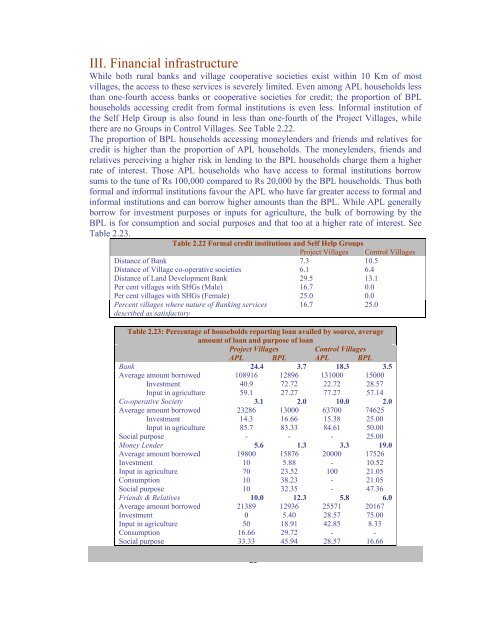
III. Financial infrastructureWhile both rural banks and village cooperative societies exist within 10 Km of mostvillages, the access to these services is severely limited. Even among APL households lessthan one-fourth access banks or cooperative societies for credit; the proportion of BPLhouseholds accessing credit from formal institutions is even less. Informal institution ofthe Self Help Group is also found in less than one-fourth of the <strong>Project</strong> Villages, whilethere are no Groups in Control Villages. See Table 2.22.The proportion of BPL households accessing moneylenders and friends and relatives forcredit is higher than the proportion of APL households. The moneylenders, friends andrelatives perceiving a higher risk in lending to the BPL households charge them a higherrate of interest. Those APL households who have access to formal institutions borrowsums to the tune of Rs 100,000 compared to Rs 20,000 by the BPL households. Thus bothformal and informal institutions favour the APL who have far greater access to formal andinformal institutions and can borrow higher amounts than the BPL. While APL generallyborrow for investment purposes or inputs for agriculture, the bulk of borrowing by theBPL is for consumption and social purposes and that too at a higher rate of interest. SeeTable 2.23.Table 2.22 Formal credit institutions and Self Help Groups<strong>Project</strong> Villages Control VillagesDistance of Bank 7.3 10.5Distance of Village co-operative societies 6.1 6.4Distance of Land Development Bank 29.5 13.1Per cent villages with SHGs (Male) 16.7 0.0Per cent villages with SHGs (Female) 25.0 0.0Percent villages where nature of Banking servicesdescribed as satisfactory- 23 -16.7 25.0Table 2.23: Percentage of households reporting loan availed by source, averageamount of loan and purpose of loan<strong>Project</strong> Villages Control VillagesAPL BPL APL BPLBank 24.4 3.7 18.3 3.5Average amount borrowed 108916 12896 131000 15000Investment 40.9 72.72 22.72 28.57Input in agriculture 59.1 27.27 77.27 57.14Co-operative Society 3.1 2.0 10.0 2.0Average amount borrowed 23286 13000 63700 74625Investment 14.3 16.66 15.38 25.00Input in agriculture 85.7 83.33 84.61 50.00Social purpose - - - 25.00Money Lender 5.6 1.3 3.3 19.0Average amount borrowed 19800 15876 20000 17526Investment 10 5.88 - 10.52Input in agriculture 70 23.52 100 21.05Consumption 10 38.23 - 21.05Social purpose 10 32.35 - 47.36Friends & Relatives 10.0 12.3 5.8 6.0Average amount borrowed 21389 12936 25571 20167Investment 0 5.40 28.57 75.00Input in agriculture 50 18.91 42.85 8.33Consumption 16.66 29.72 - -Social purpose 33.33 45.94 28.57 16.66