Download PDF - Rajasthan Rural Livelihoods Project
Download PDF - Rajasthan Rural Livelihoods Project
Download PDF - Rajasthan Rural Livelihoods Project

You also want an ePaper? Increase the reach of your titles
YUMPU automatically turns print PDFs into web optimized ePapers that Google loves.
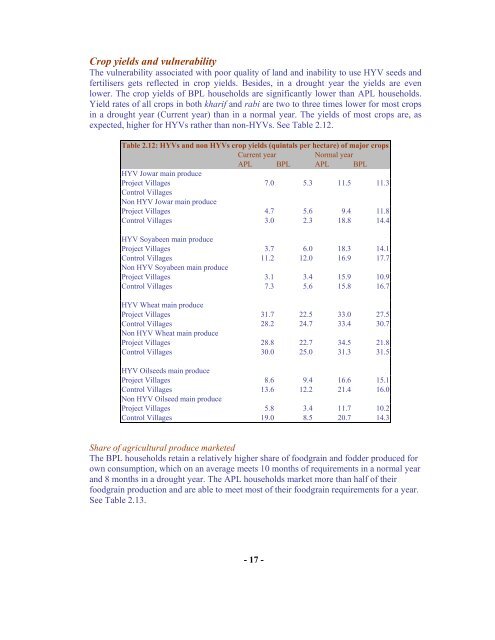
Crop yields and vulnerabilityThe vulnerability associated with poor quality of land and inability to use HYV seeds andfertilisers gets reflected in crop yields. Besides, in a drought year the yields are evenlower. The crop yields of BPL households are significantly lower than APL households.Yield rates of all crops in both kharif and rabi are two to three times lower for most cropsin a drought year (Current year) than in a normal year. The yields of most crops are, asexpected, higher for HYVs rather than non-HYVs. See Table 2.12.Table 2.12: HYVs and non HYVs crop yields (quintals per hectare) of major cropsCurrent yearNormal yearAPL BPL APL BPLHYV Jowar main produce<strong>Project</strong> Villages 7.0 5.3 11.5 11.3Control VillagesNon HYV Jowar main produce<strong>Project</strong> Villages 4.7 5.6 9.4 11.8Control Villages 3.0 2.3 18.8 14.4HYV Soyabeen main produce<strong>Project</strong> Villages 3.7 6.0 18.3 14.1Control Villages 11.2 12.0 16.9 17.7Non HYV Soyabeen main produce<strong>Project</strong> Villages 3.1 3.4 15.9 10.9Control Villages 7.3 5.6 15.8 16.7HYV Wheat main produce<strong>Project</strong> Villages 31.7 22.5 33.0 27.5Control Villages 28.2 24.7 33.4 30.7Non HYV Wheat main produce<strong>Project</strong> Villages 28.8 22.7 34.5 21.8Control Villages 30.0 25.0 31.3 31.5HYV Oilseeds main produce<strong>Project</strong> Villages 8.6 9.4 16.6 15.1Control Villages 13.6 12.2 21.4 16.0Non HYV Oilseed main produce<strong>Project</strong> Villages 5.8 3.4 11.7 10.2Control Villages 19.0 8.5 20.7 14.3Share of agricultural produce marketedThe BPL households retain a relatively higher share of foodgrain and fodder produced forown consumption, which on an average meets 10 months of requirements in a normal yearand 8 months in a drought year. The APL households market more than half of theirfoodgrain production and are able to meet most of their foodgrain requirements for a year.See Table 2.13.- 17 -