Download PDF - Rajasthan Rural Livelihoods Project
Download PDF - Rajasthan Rural Livelihoods Project
Download PDF - Rajasthan Rural Livelihoods Project

Create successful ePaper yourself
Turn your PDF publications into a flip-book with our unique Google optimized e-Paper software.
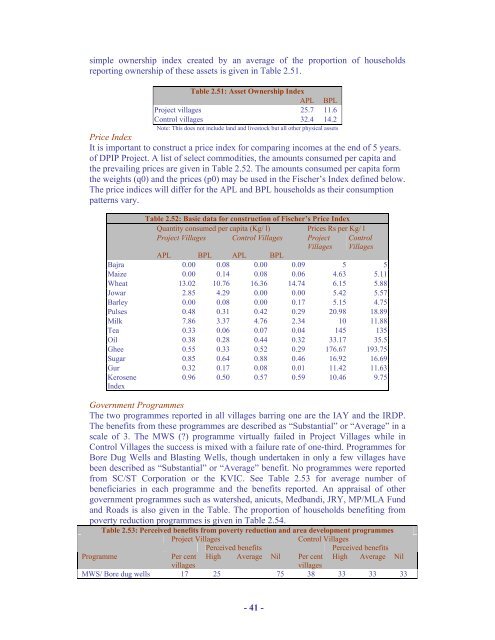
simple ownership index created by an average of the proportion of householdsreporting ownership of these assets is given in Table 2.51.Table 2.51: Asset Ownership IndexAPL BPL<strong>Project</strong> villages 25.7 11.6Control villages 32.4 14.2Note: This does not include land and livestock but all other physical assetsPrice IndexIt is important to construct a price index for comparing incomes at the end of 5 years.of DPIP <strong>Project</strong>. A list of select commodities, the amounts consumed per capita andthe prevailing prices are given in Table 2.52. The amounts consumed per capita formthe weights (q0) and the prices (p0) may be used in the Fischer’s Index defined below.The price indices will differ for the APL and BPL households as their consumptionpatterns vary.Table 2.52: Basic data for construction of Fischer’s Price IndexQuantity consumed per capita (Kg/ l) Prices Rs per Kg/ l<strong>Project</strong> Villages Control Villages <strong>Project</strong>VillagesControlVillagesAPL BPL APL BPLBajra 0.00 0.08 0.00 0.09 5 5Maize 0.00 0.14 0.08 0.06 4.63 5.11Wheat 13.02 10.76 16.36 14.74 6.15 5.88Jowar 2.85 4.29 0.00 0.00 5.42 5.57Barley 0.00 0.08 0.00 0.17 5.15 4.75Pulses 0.48 0.31 0.42 0.29 20.98 18.89Milk 7.86 3.37 4.76 2.34 10 11.88Tea 0.33 0.06 0.07 0.04 145 135Oil 0.38 0.28 0.44 0.32 33.17 35.5Ghee 0.55 0.33 0.52 0.29 176.67 193.75Sugar 0.85 0.64 0.88 0.46 16.92 16.69Gur 0.32 0.17 0.08 0.01 11.42 11.63KeroseneIndex0.96 0.50 0.57 0.59 10.46 9.75Government ProgrammesThe two programmes reported in all villages barring one are the IAY and the IRDP.The benefits from these programmes are described as “Substantial” or “Average” in ascale of 3. The MWS (?) programme virtually failed in <strong>Project</strong> Villages while inControl Villages the success is mixed with a failure rate of one-third. Programmes forBore Dug Wells and Blasting Wells, though undertaken in only a few villages havebeen described as “Substantial” or “Average” benefit. No programmes were reportedfrom SC/ST Corporation or the KVIC. See Table 2.53 for average number ofbeneficiaries in each programme and the benefits reported. An appraisal of othergovernment programmes such as watershed, anicuts, Medbandi, JRY, MP/MLA Fundand Roads is also given in the Table. The proportion of households benefiting frompoverty reduction programmes is given in Table 2.54.Table 2.53: Perceived benefits from poverty reduction and area development programmes<strong>Project</strong> VillagesControl VillagesPerceived benefitsPerceived benefitsProgrammePer cent High Average Nil Per cent High Average NilvillagesvillagesMWS/ Bore dug wells 17 25 75 38 33 33 33- 41 -