Download PDF - Rajasthan Rural Livelihoods Project
Download PDF - Rajasthan Rural Livelihoods Project
Download PDF - Rajasthan Rural Livelihoods Project

Create successful ePaper yourself
Turn your PDF publications into a flip-book with our unique Google optimized e-Paper software.
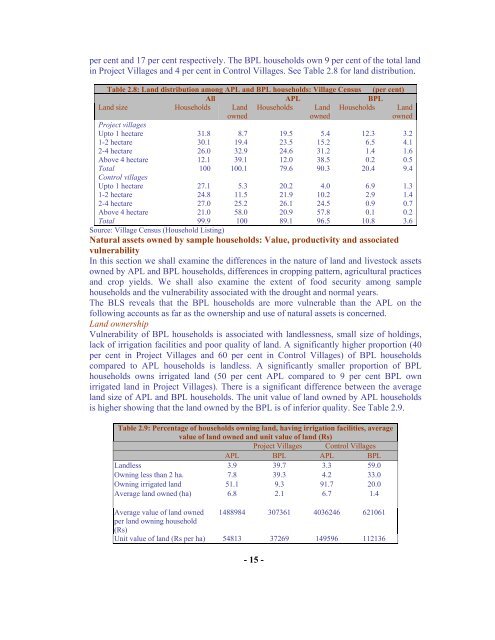
per cent and 17 per cent respectively. The BPL households own 9 per cent of the total landin <strong>Project</strong> Villages and 4 per cent in Control Villages. See Table 2.8 for land distribution.Table 2.8: Land distribution among APL and BPL households: Village Census (per cent)All APL BPLLand size Households LandownedHouseholds LandownedHouseholds Landowned<strong>Project</strong> villagesUpto 1 hectare 31.8 8.7 19.5 5.4 12.3 3.21-2 hectare 30.1 19.4 23.5 15.2 6.5 4.12-4 hectare 26.0 32.9 24.6 31.2 1.4 1.6Above 4 hectare 12.1 39.1 12.0 38.5 0.2 0.5Total 100 100.1 79.6 90.3 20.4 9.4Control villagesUpto 1 hectare 27.1 5.3 20.2 4.0 6.9 1.31-2 hectare 24.8 11.5 21.9 10.2 2.9 1.42-4 hectare 27.0 25.2 26.1 24.5 0.9 0.7Above 4 hectare 21.0 58.0 20.9 57.8 0.1 0.2Total 99.9 100 89.1 96.5 10.8 3.6Source: Village Census (Household Listing)Natural assets owned by sample households: Value, productivity and associatedvulnerabilityIn this section we shall examine the differences in the nature of land and livestock assetsowned by APL and BPL households, differences in cropping pattern, agricultural practicesand crop yields. We shall also examine the extent of food security among samplehouseholds and the vulnerability associated with the drought and normal years.The BLS reveals that the BPL households are more vulnerable than the APL on thefollowing accounts as far as the ownership and use of natural assets is concerned.Land ownershipVulnerability of BPL households is associated with landlessness, small size of holdings,lack of irrigation facilities and poor quality of land. A significantly higher proportion (40per cent in <strong>Project</strong> Villages and 60 per cent in Control Villages) of BPL householdscompared to APL households is landless. A significantly smaller proportion of BPLhouseholds owns irrigated land (50 per cent APL compared to 9 per cent BPL ownirrigated land in <strong>Project</strong> Villages). There is a significant difference between the averageland size of APL and BPL households. The unit value of land owned by APL householdsis higher showing that the land owned by the BPL is of inferior quality. See Table 2.9.Table 2.9: Percentage of households owning land, having irrigation facilities, averagevalue of land owned and unit value of land (Rs)<strong>Project</strong> Villages Control VillagesAPL BPL APL BPLLandless 3.9 39.7 3.3 59.0Owning less than 2 ha. 7.8 39.3 4.2 33.0Owning irrigated land 51.1 9.3 91.7 20.0Average land owned (ha) 6.8 2.1 6.7 1.4Average value of land owned 1488984 307361 4036246 621061per land owning household(Rs)Unit value of land (Rs per ha) 54813 37269 149596 112136- 15 -