Methods Applying AHRQ Quality Indicators to Healthcare ... - HCUP
Methods Applying AHRQ Quality Indicators to Healthcare ... - HCUP
Methods Applying AHRQ Quality Indicators to Healthcare ... - HCUP

Create successful ePaper yourself
Turn your PDF publications into a flip-book with our unique Google optimized e-Paper software.
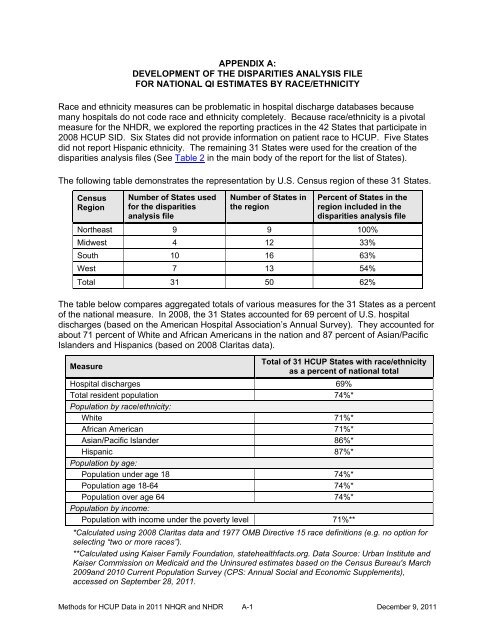
APPENDIX A:DEVELOPMENT OF THE DISPARITIES ANALYSIS FILEFOR NATIONAL QI ESTIMATES BY RACE/ETHNICITYRace and ethnicity measures can be problematic in hospital discharge databases becausemany hospitals do not code race and ethnicity completely. Because race/ethnicity is a pivotalmeasure for the NHDR, we explored the reporting practices in the 42 States that participate in2008 <strong>HCUP</strong> SID. Six States did not provide information on patient race <strong>to</strong> <strong>HCUP</strong>. Five Statesdid not report Hispanic ethnicity. The remaining 31 States were used for the creation of thedisparities analysis files (See Table 2 in the main body of the report for the list of States).The following table demonstrates the representation by U.S. Census region of these 31 States.CensusRegionNumber of States usedfor the disparitiesanalysis fileNumber of States inthe regionPercent of States in theregion included in thedisparities analysis fileNortheast 9 9 100%Midwest 4 12 33%South 10 16 63%West 7 13 54%Total 31 50 62%The table below compares aggregated <strong>to</strong>tals of various measures for the 31 States as a percen<strong>to</strong>f the national measure. In 2008, the 31 States accounted for 69 percent of U.S. hospitaldischarges (based on the American Hospital Association’s Annual Survey). They accounted forabout 71 percent of White and African Americans in the nation and 87 percent of Asian/PacificIslanders and Hispanics (based on 2008 Claritas data).MeasureTotal of 31 <strong>HCUP</strong> States with race/ethnicityas a percent of national <strong>to</strong>talHospital discharges 69%Total resident population 74%*Population by race/ethnicity:White 71%*African American 71%*Asian/Pacific Islander 86%*Hispanic 87%*Population by age:Population under age 18 74%*Population age 18-64 74%*Population over age 64 74%*Population by income:Population with income under the poverty level 71%***Calculated using 2008 Claritas data and 1977 OMB Directive 15 race definitions (e.g. no option forselecting “two or more races”).**Calculated using Kaiser Family Foundation, statehealthfacts.org. Data Source: Urban Institute andKaiser Commission on Medicaid and the Uninsured estimates based on the Census Bureau's March2009and 2010 Current Population Survey (CPS: Annual Social and Economic Supplements),accessed on September 28, 2011.<strong>Methods</strong> for <strong>HCUP</strong> Data in 2011 NHQR and NHDR A-1December 9, 2011