. Standard error estimates for age/sex adjusted inpatient rates per 100,000 populationusing the 2008 Claritas population data.We adjusted rates for age and sex using the method of direct standardization (Fleiss, 1973).We estimated the observed rates for each of 36 age/sex categories (described in Table 3 inthis methods report, Age Groupings for Risk Adjustment). We then calculated the weightedaverage of those 36 rates using weights proportional <strong>to</strong> the percentage of a standardpopulation in each cell. Therefore, the adjusted rate represents the rate that would beexpected for the observed study population if it had the same age and sex distribution as thestandard population.For the standard population we used the age and sex distribution of the U.S. as a wholeaccording <strong>to</strong> the year 2000. In theory, differences among adjusted rates were notattributable <strong>to</strong> differences in the age and sex distributions among the comparison groupsbecause the rates were all calculated with a common age and sex distribution.The adjusted rate was calculated as follows (and subsequently multiplied by 100,000):A 36g 1Ng , std36g 1n(g )i1 g , obsNwg,stdg,iNxg,i36g 1n(g )i1NNNg,stdg , obsstdwg,ixg , i36g 1n(g )i1Nwstd*g , ixg , iS *Ng = index for the 36 age/sex cells.N g,std = Standard population for cell g (year 2000 <strong>to</strong>tal US population in cell g).N g,obs = Observed population for cell g (year 2008 subpopulation in cell g, e.g., females,state of California, etc.).n(g) = Number in the sample for cell g.x g,i = Observed quality indica<strong>to</strong>r for observation i in cell g (e.g., 0 or 1 indica<strong>to</strong>r).w g,i = NIS or SID discharge weight for observation i in cell g.The estimates for the numera<strong>to</strong>r, S*, and its standard error, SE S* , were calculated in similarfashion <strong>to</strong> the unadjusted estimates for the numera<strong>to</strong>r S in formula A.1. The only differencewas that the weight for patient i in cell g was redefined as:* g,stdwg, i wg,iNg,obsstd.(A.3)N (A.4)Following instructions in the NIS Variance Report (modified for the SID, as explainedabove), we used PROC SURVEYMEANS <strong>to</strong> obtain the estimate of S*, the weighted sum inthe numera<strong>to</strong>r using the revised weights, and the estimate SE S* , the standard error of theweighted sum S*. The denomina<strong>to</strong>r is a constant. Therefore, the standard error of theadjusted rate, A, was calculated asSE A =100,000 SE S* / N std .(A.5)<strong>Methods</strong> for <strong>HCUP</strong> Data in 2011 NHQR and NHDR C-2December 9, 2011
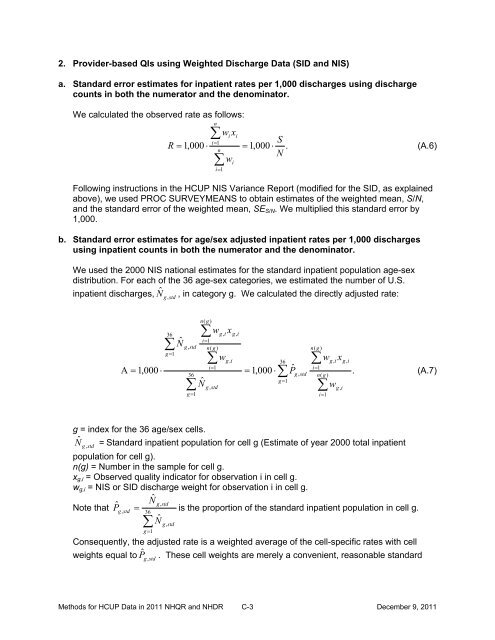
2. Provider-based QIs using Weighted Discharge Data (SID and NIS)a. Standard error estimates for inpatient rates per 1,000 discharges using dischargecounts in both the numera<strong>to</strong>r and the denomina<strong>to</strong>r.We calculated the observed rate as follows:R 1,000 ni1ni1w xiwii 1,000 SN.(A.6)Following instructions in the <strong>HCUP</strong> NIS Variance Report (modified for the SID, as explainedabove), we used PROC SURVEYMEANS <strong>to</strong> obtain estimates of the weighted mean, S/N,and the standard error of the weighted mean, SE S/N . We multiplied this standard error by1,000.b. Standard error estimates for age/sex adjusted inpatient rates per 1,000 dischargesusing inpatient counts in both the numera<strong>to</strong>r and the denomina<strong>to</strong>r.We used the 2000 NIS national estimates for the standard inpatient population age-sexdistribution. For each of the 36 age-sex categories, we estimated the number of U.S.inpatient discharges, ˆ , in category g. We calculated the directly adjusted rate:Ng , stdw36g,ixg,iˆ i1 Ng,std n(g )n(g )g 1 wg,i36 wg,ixi1A 1,0001,000 ˆ i1 36 Pg, std n(g )ˆg1Nwg1n(g )g,stdi1g,ig,i.(A.7)g = index for the 36 age/sex cells.N ˆ g , std= Standard inpatient population for cell g (Estimate of year 2000 <strong>to</strong>tal inpatientpopulation for cell g).n(g) = Number in the sample for cell g.x g,i = Observed quality indica<strong>to</strong>r for observation i in cell g.w g,i = NIS or SID discharge weight for observation i in cell g.ˆ,Note that ˆNg stdPg, stdis the proportion of the standard inpatient population in cell g.Nˆ 36g1g,stdConsequently, the adjusted rate is a weighted average of the cell-specific rates with cellweights equal <strong>to</strong> ˆ . These cell weights are merely a convenient, reasonable standardPg , std<strong>Methods</strong> for <strong>HCUP</strong> Data in 2011 NHQR and NHDR C-3December 9, 2011