Methods Applying AHRQ Quality Indicators to Healthcare ... - HCUP
Methods Applying AHRQ Quality Indicators to Healthcare ... - HCUP
Methods Applying AHRQ Quality Indicators to Healthcare ... - HCUP

You also want an ePaper? Increase the reach of your titles
YUMPU automatically turns print PDFs into web optimized ePapers that Google loves.
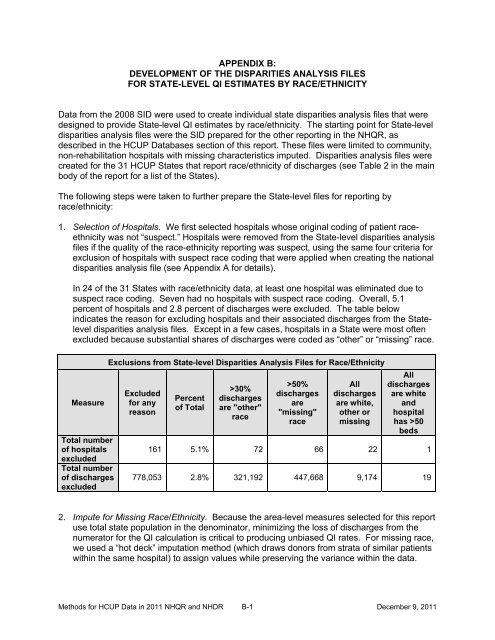
APPENDIX B:DEVELOPMENT OF THE DISPARITIES ANALYSIS FILESFOR STATE-LEVEL QI ESTIMATES BY RACE/ETHNICITYData from the 2008 SID were used <strong>to</strong> create individual state disparities analysis files that weredesigned <strong>to</strong> provide State-level QI estimates by race/ethnicity. The starting point for State-leveldisparities analysis files were the SID prepared for the other reporting in the NHQR, asdescribed in the <strong>HCUP</strong> Databases section of this report. These files were limited <strong>to</strong> community,non-rehabilitation hospitals with missing characteristics imputed. Disparities analysis files werecreated for the 31 <strong>HCUP</strong> States that report race/ethnicity of discharges (see Table 2 in the mainbody of the report for a list of the States).The following steps were taken <strong>to</strong> further prepare the State-level files for reporting byrace/ethnicity:1. Selection of Hospitals. We first selected hospitals whose original coding of patient raceethnicitywas not “suspect.” Hospitals were removed from the State-level disparities analysisfiles if the quality of the race-ethnicity reporting was suspect, using the same four criteria forexclusion of hospitals with suspect race coding that were applied when creating the nationaldisparities analysis file (see Appendix A for details).In 24 of the 31 States with race/ethnicity data, at least one hospital was eliminated due <strong>to</strong>suspect race coding. Seven had no hospitals with suspect race coding. Overall, 5.1percent of hospitals and 2.8 percent of discharges were excluded. The table belowindicates the reason for excluding hospitals and their associated discharges from the Stateleveldisparities analysis files. Except in a few cases, hospitals in a State were most oftenexcluded because substantial shares of discharges were coded as “other” or “missing” race.MeasureTotal numberof hospitalsexcludedTotal numberof dischargesexcludedExclusions from State-level Disparities Analysis Files for Race/EthnicityExcludedfor anyreasonPercen<strong>to</strong>f Total>30%dischargesare "other"race>50%dischargesare"missing"raceAlldischargesare white,other ormissingAlldischargesare whiteandhospitalhas >50beds161 5.1% 72 66 22 1778,053 2.8% 321,192 447,668 9,174 192. Impute for Missing Race/Ethnicity. Because the area-level measures selected for this reportuse <strong>to</strong>tal state population in the denomina<strong>to</strong>r, minimizing the loss of discharges from thenumera<strong>to</strong>r for the QI calculation is critical <strong>to</strong> producing unbiased QI rates. For missing race,we used a “hot deck” imputation method (which draws donors from strata of similar patientswithin the same hospital) <strong>to</strong> assign values while preserving the variance within the data.<strong>Methods</strong> for <strong>HCUP</strong> Data in 2011 NHQR and NHDR B-1December 9, 2011