Methods Applying AHRQ Quality Indicators to Healthcare ... - HCUP
Methods Applying AHRQ Quality Indicators to Healthcare ... - HCUP
Methods Applying AHRQ Quality Indicators to Healthcare ... - HCUP
Create successful ePaper yourself
Turn your PDF publications into a flip-book with our unique Google optimized e-Paper software.
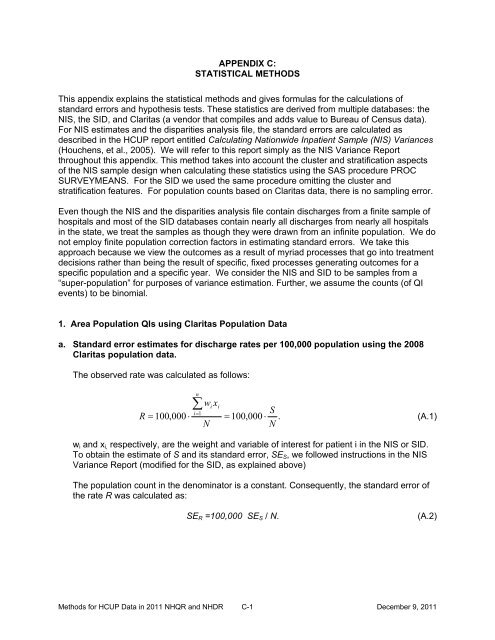
APPENDIX C:STATISTICAL METHODSThis appendix explains the statistical methods and gives formulas for the calculations ofstandard errors and hypothesis tests. These statistics are derived from multiple databases: theNIS, the SID, and Claritas (a vendor that compiles and adds value <strong>to</strong> Bureau of Census data).For NIS estimates and the disparities analysis file, the standard errors are calculated asdescribed in the <strong>HCUP</strong> report entitled Calculating Nationwide Inpatient Sample (NIS) Variances(Houchens, et al., 2005). We will refer <strong>to</strong> this report simply as the NIS Variance Reportthroughout this appendix. This method takes in<strong>to</strong> account the cluster and stratification aspectsof the NIS sample design when calculating these statistics using the SAS procedure PROCSURVEYMEANS. For the SID we used the same procedure omitting the cluster andstratification features. For population counts based on Claritas data, there is no sampling error.Even though the NIS and the disparities analysis file contain discharges from a finite sample ofhospitals and most of the SID databases contain nearly all discharges from nearly all hospitalsin the state, we treat the samples as though they were drawn from an infinite population. We donot employ finite population correction fac<strong>to</strong>rs in estimating standard errors. We take thisapproach because we view the outcomes as a result of myriad processes that go in<strong>to</strong> treatmentdecisions rather than being the result of specific, fixed processes generating outcomes for aspecific population and a specific year. We consider the NIS and SID <strong>to</strong> be samples from a“super-population” for purposes of variance estimation. Further, we assume the counts (of QIevents) <strong>to</strong> be binomial.1. Area Population QIs using Claritas Population Dataa. Standard error estimates for discharge rates per 100,000 population using the 2008Claritas population data.The observed rate was calculated as follows:R 100,000 ni1w xNii 100,000 SN.(A.1)w i and x i, respectively, are the weight and variable of interest for patient i in the NIS or SID.To obtain the estimate of S and its standard error, SE S , we followed instructions in the NISVariance Report (modified for the SID, as explained above)The population count in the denomina<strong>to</strong>r is a constant. Consequently, the standard error ofthe rate R was calculated as:SE R =100,000 SE S / N.(A.2)<strong>Methods</strong> for <strong>HCUP</strong> Data in 2011 NHQR and NHDR C-1December 9, 2011


