Tullow Oil plc 2011/2012 Corporate Responsibility Report - The Group
Tullow Oil plc 2011/2012 Corporate Responsibility Report - The Group
Tullow Oil plc 2011/2012 Corporate Responsibility Report - The Group
- No tags were found...
Create successful ePaper yourself
Turn your PDF publications into a flip-book with our unique Google optimized e-Paper software.
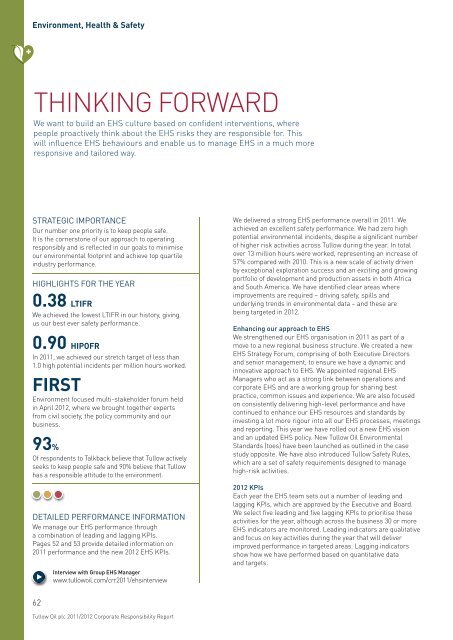
Environment, Health & SafetyTHINKING FORWARDWe want to build an EHS culture based on confident interventions, wherepeople proactively think about the EHS risks they are responsible for. Thiswill influence EHS behaviours and enable us to manage EHS in a much moreresponsive and tailored way.STRATEGIC IMPORTANCEOur number one priority is to keep people safe.It is the cornerstone of our approach to operatingresponsibly and is reflected in our goals to minimiseour environmental footprint and achieve top quartileindustry performance.HIGHLIGHTS FOR THE YEAR0.38 LTIFRWe achieved the lowest LTIFR in our history, givingus our best ever safety performance.0.90 HIPOFRIn <strong>2011</strong>, we achieved our stretch target of less than1.0 high potential incidents per million hours worked.FIRSTEnvironment focused multi-stakeholder forum heldin April <strong>2012</strong>, where we brought together expertsfrom civil society, the policy community and ourbusiness.93%Of respondents to Talkback believe that <strong>Tullow</strong> activelyseeks to keep people safe and 90% believe that <strong>Tullow</strong>has a responsible attitude to the environment.DETAILED PERFORMANCE INFORMATIONWe manage our EHS performance througha combination of leading and lagging KPIs.Pages 52 and 53 provide detailed information on<strong>2011</strong> performance and the new <strong>2012</strong> EHS KPIs.Interview with <strong>Group</strong> EHS Managerwww.tullowoil.com/crr<strong>2011</strong>/ehsinterviewWe delivered a strong EHS performance overall in <strong>2011</strong>. Weachieved an excellent safety performance. We had zero highpotential environmental incidents, despite a significant numberof higher risk activities across <strong>Tullow</strong> during the year. In totalover 13 million hours were worked, representing an increase of57% compared with 2010. This is a new scale of activity drivenby exceptional exploration success and an exciting and growingportfolio of development and production assets in both Africaand South America. We have identified clear areas whereimprovements are required – driving safety, spills andunderlying trends in environmental data – and these arebeing targeted in <strong>2012</strong>.Enhancing our approach to EHSWe strengthened our EHS organisation in <strong>2011</strong> as part of amove to a new regional business structure. We created a newEHS Strategy Forum, comprising of both Executive Directorsand senior management, to ensure we have a dynamic andinnovative approach to EHS. We appointed regional EHSManagers who act as a strong link between operations andcorporate EHS and are a working group for sharing bestpractice, common issues and experience. We are also focusedon consistently delivering high-level performance and havecontinued to enhance our EHS resources and standards byinvesting a lot more rigour into all our EHS processes, meetingsand reporting. This year we have rolled out a new EHS visionand an updated EHS policy. New <strong>Tullow</strong> <strong>Oil</strong> EnvironmentalStandards (toes) have been launched as outlined in the casestudy opposite. We have also introduced <strong>Tullow</strong> Safety Rules,which are a set of safety requirements designed to managehigh-risk activities.<strong>2012</strong> KPIsEach year the EHS team sets out a number of leading andlagging KPIs, which are approved by the Executive and Board.We select five leading and five lagging KPIs to prioritise theseactivities for the year, although across the business 30 or moreEHS indicators are monitored. Leading indicators are qualitativeand focus on key activities during the year that will deliverimproved performance in targeted areas. Lagging indicatorsshow how we have performed based on quantitative dataand targets.62<strong>Tullow</strong> <strong>Oil</strong> <strong>plc</strong> <strong>2011</strong>/<strong>2012</strong> <strong>Corporate</strong> <strong>Responsibility</strong> <strong>Report</strong>


