Tullow Oil plc 2011/2012 Corporate Responsibility Report - The Group
Tullow Oil plc 2011/2012 Corporate Responsibility Report - The Group
Tullow Oil plc 2011/2012 Corporate Responsibility Report - The Group
- No tags were found...

Create successful ePaper yourself
Turn your PDF publications into a flip-book with our unique Google optimized e-Paper software.
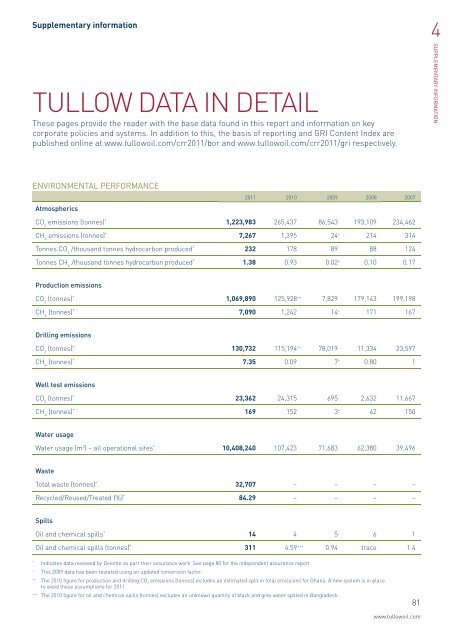
Supplementary informationTULLOW DATA IN DETAIL<strong>The</strong>se pages provide the reader with the base data found in this report and information on keycorporate policies and systems. In addition to this, the basis of reporting and GRI Content Index arepublished online at www.tullowoil.com/crr<strong>2011</strong>/bor and www.tullowoil.com/crr<strong>2011</strong>/gri respectively.4SUPPLEMENTARY INFORMATIONENVIRONMENTAL PERFORMANCEAtmospherics<strong>2011</strong> 2010 2009 2008 2007CO 2emissions (tonnes) * 1,223,983 265,437 86,543 193,109 234,462CH 4emissions (tonnes) * 7,267 1,395 24 + 214 314Tonnes CO 2/thousand tonnes hydrocarbon produced * 232 178 89 88 124Tonnes CH 4/thousand tonnes hydrocarbon produced * 1.38 0.93 0.02 + 0.10 0.17Production emissionsCO 2(tonnes) * 1,069,890 125,928 ++ 7,829 179,143 199,198CH 4(tonnes) * 7,090 1,242 14 + 171 167Drilling emissionsCO 2(tonnes) * 130,732 115,194 ++ 78,019 11,334 23,597CH 4(tonnes) * 7.35 0.09 7 + 0.80 1Well test emissionsCO 2(tonnes) * 23,362 24,315 695 2,632 11,667CH 4(tonnes) * 169 152 3 + 42 150Water usageWater usage (m 3 ) – all operational sites * 10,408,240 107,423 71,683 62,380 39,496WasteTotal waste (tonnes) * 32,707 – – – –Recycled/Reused/Treated (%) * 84.29 – – – –Spills<strong>Oil</strong> and chemical spills * 14 4 5 6 1<strong>Oil</strong> and chemical spills (tonnes) * 311 4.59 +++ 0.94 trace 1.4*Indicates data reviewed by Deloitte as part their assurance work. See page 80 for the independent assurance report.+This 2009 data has been restated using an updated conversion factor.++<strong>The</strong> 2010 figure for production and drilling CO 2emissions (tonnes) includes an estimated split in total emissions for Ghana. A new system is in placeto avoid these assumptions for <strong>2011</strong>.+++<strong>The</strong> 2010 figure for oil and chemical spills (tonnes) excludes an unknown quantity of black and grey water spilled in Bangladesh.81www.tullowoil.com