Tullow Oil plc 2011/2012 Corporate Responsibility Report - The Group
Tullow Oil plc 2011/2012 Corporate Responsibility Report - The Group
Tullow Oil plc 2011/2012 Corporate Responsibility Report - The Group
- No tags were found...

You also want an ePaper? Increase the reach of your titles
YUMPU automatically turns print PDFs into web optimized ePapers that Google loves.
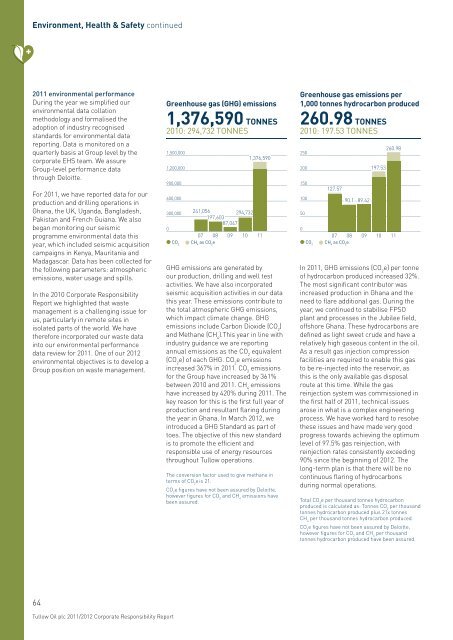
Environment, Health & Safety continued<strong>2011</strong> environmental performanceDuring the year we simplified ourenvironmental data collationmethodology and formalised theadoption of industry recognisedstandards for environmental datareporting. Data is monitored on aquarterly basis at <strong>Group</strong> level by thecorporate EHS team. We assure<strong>Group</strong>-level performance datathrough Deloitte.For <strong>2011</strong>, we have reported data for ourproduction and drilling operations inGhana, the UK, Uganda, Bangladesh,Pakistan and French Guiana. We alsobegan monitoring our seismicprogramme environmental data thisyear, which included seismic acquisitioncampaigns in Kenya, Mauritania andMadagascar. Data has been collected forthe following parameters: atmosphericemissions, water usage and spills.In the 2010 <strong>Corporate</strong> <strong>Responsibility</strong><strong>Report</strong> we highlighted that wastemanagement is a challenging issue forus, particularly in remote sites inisolated parts of the world. We havetherefore incorporated our waste datainto our environmental performancedata review for <strong>2011</strong>. One of our <strong>2012</strong>environmental objectives is to develop a<strong>Group</strong> position on waste management.Greenhouse gas (GHG) emissions1,376,590 TONNES2010: 294,732 TONNES1,500,0001,200,000900,000600,000300,0000CO 2241,056 294,732197,60387,0471,376,59007 08 09 10 11CH 4as CO 2eGHG emissions are generated byour production, drilling and well testactivities. We have also incorporatedseismic acquisition activities in our datathis year. <strong>The</strong>se emissions contribute tothe total atmospheric GHG emissions,which impact climate change. GHGemissions include Carbon Dioxide (CO 2)and Methane (CH 4).This year in line withindustry guidance we are reportingannual emissions as the CO 2equivalent(CO 2e) of each GHG. CO 2e emissionsincreased 367% in <strong>2011</strong>. CO 2emissionsfor the <strong>Group</strong> have increased by 361%between 2010 and <strong>2011</strong>. CH 4emissionshave increased by 420% during <strong>2011</strong>. <strong>The</strong>key reason for this is the first full year ofproduction and resultant flaring duringthe year in Ghana. In March <strong>2012</strong>, weintroduced a GHG Standard as part oftoes. <strong>The</strong> objective of this new standardis to promote the efficient andresponsible use of energy resourcesthroughout <strong>Tullow</strong> operations.<strong>The</strong> conversion factor used to give methane interms of CO 2e is 21.CO 2e figures have not been assured by Deloitte,however figures for CO 2and CH 4emissions havebeen assured.Greenhouse gas emissions per1,000 tonnes hydrocarbon produced260.98 TONNES2010: 197.53 TONNES250200150100500CO 2127.5790.107 08CH 4as CO 2e89.42In <strong>2011</strong>, GHG emissions (CO 2e) per tonneof hydrocarbon produced increased 32%.<strong>The</strong> most significant contributor wasincreased production in Ghana and theneed to flare additional gas. During theyear, we continued to stabilise FPSOplant and processes in the Jubilee field,offshore Ghana. <strong>The</strong>se hydrocarbons aredefined as light sweet crude and have arelatively high gaseous content in the oil.As a result gas injection compressionfacilities are required to enable this gasto be re-injected into the reservoir, asthis is the only available gas disposalroute at this time. While the gasreinjection system was commissioned inthe first half of <strong>2011</strong>, technical issuesarose in what is a complex engineeringprocess. We have worked hard to resolvethese issues and have made very goodprogress towards achieving the optimumlevel of 97.5% gas reinjection, withreinjection rates consistently exceeding90% since the beginning of <strong>2012</strong>. <strong>The</strong>long-term plan is that there will be nocontinuous flaring of hydrocarbonsduring normal operations.Total CO 2e per thousand tonnes hydrocarbonproduced is calculated as: Tonnes CO 2per thousandtonnes hydrocarbon produced plus 21x tonnesCH 4per thousand tonnes hydrocarbon produced.CO 2e figures have not been assured by Deloitte,however figures for CO 2and CH 4per thousandtonnes hydrocarbon produced have been assured.09197.5310260.981164<strong>Tullow</strong> <strong>Oil</strong> <strong>plc</strong> <strong>2011</strong>/<strong>2012</strong> <strong>Corporate</strong> <strong>Responsibility</strong> <strong>Report</strong>