Environment, Health & Safety continued<strong>2011</strong> environmental performanceDuring the year we simplified ourenvironmental data collationmethodology and formalised theadoption of industry recognisedstandards for environmental datareporting. Data is monitored on aquarterly basis at <strong>Group</strong> level by thecorporate EHS team. We assure<strong>Group</strong>-level performance datathrough Deloitte.For <strong>2011</strong>, we have reported data for ourproduction and drilling operations inGhana, the UK, Uganda, Bangladesh,Pakistan and French Guiana. We alsobegan monitoring our seismicprogramme environmental data thisyear, which included seismic acquisitioncampaigns in Kenya, Mauritania andMadagascar. Data has been collected forthe following parameters: atmosphericemissions, water usage and spills.In the 2010 <strong>Corporate</strong> <strong>Responsibility</strong><strong>Report</strong> we highlighted that wastemanagement is a challenging issue forus, particularly in remote sites inisolated parts of the world. We havetherefore incorporated our waste datainto our environmental performancedata review for <strong>2011</strong>. One of our <strong>2012</strong>environmental objectives is to develop a<strong>Group</strong> position on waste management.Greenhouse gas (GHG) emissions1,376,590 TONNES2010: 294,732 TONNES1,500,0001,200,000900,000600,000300,0000CO 2241,056 294,732197,60387,0471,376,59007 08 09 10 11CH 4as CO 2eGHG emissions are generated byour production, drilling and well testactivities. We have also incorporatedseismic acquisition activities in our datathis year. <strong>The</strong>se emissions contribute tothe total atmospheric GHG emissions,which impact climate change. GHGemissions include Carbon Dioxide (CO 2)and Methane (CH 4).This year in line withindustry guidance we are reportingannual emissions as the CO 2equivalent(CO 2e) of each GHG. CO 2e emissionsincreased 367% in <strong>2011</strong>. CO 2emissionsfor the <strong>Group</strong> have increased by 361%between 2010 and <strong>2011</strong>. CH 4emissionshave increased by 420% during <strong>2011</strong>. <strong>The</strong>key reason for this is the first full year ofproduction and resultant flaring duringthe year in Ghana. In March <strong>2012</strong>, weintroduced a GHG Standard as part oftoes. <strong>The</strong> objective of this new standardis to promote the efficient andresponsible use of energy resourcesthroughout <strong>Tullow</strong> operations.<strong>The</strong> conversion factor used to give methane interms of CO 2e is 21.CO 2e figures have not been assured by Deloitte,however figures for CO 2and CH 4emissions havebeen assured.Greenhouse gas emissions per1,000 tonnes hydrocarbon produced260.98 TONNES2010: 197.53 TONNES250200150100500CO 2127.5790.107 08CH 4as CO 2e89.42In <strong>2011</strong>, GHG emissions (CO 2e) per tonneof hydrocarbon produced increased 32%.<strong>The</strong> most significant contributor wasincreased production in Ghana and theneed to flare additional gas. During theyear, we continued to stabilise FPSOplant and processes in the Jubilee field,offshore Ghana. <strong>The</strong>se hydrocarbons aredefined as light sweet crude and have arelatively high gaseous content in the oil.As a result gas injection compressionfacilities are required to enable this gasto be re-injected into the reservoir, asthis is the only available gas disposalroute at this time. While the gasreinjection system was commissioned inthe first half of <strong>2011</strong>, technical issuesarose in what is a complex engineeringprocess. We have worked hard to resolvethese issues and have made very goodprogress towards achieving the optimumlevel of 97.5% gas reinjection, withreinjection rates consistently exceeding90% since the beginning of <strong>2012</strong>. <strong>The</strong>long-term plan is that there will be nocontinuous flaring of hydrocarbonsduring normal operations.Total CO 2e per thousand tonnes hydrocarbonproduced is calculated as: Tonnes CO 2per thousandtonnes hydrocarbon produced plus 21x tonnesCH 4per thousand tonnes hydrocarbon produced.CO 2e figures have not been assured by Deloitte,however figures for CO 2and CH 4per thousandtonnes hydrocarbon produced have been assured.09197.5310260.981164<strong>Tullow</strong> <strong>Oil</strong> <strong>plc</strong> <strong>2011</strong>/<strong>2012</strong> <strong>Corporate</strong> <strong>Responsibility</strong> <strong>Report</strong>
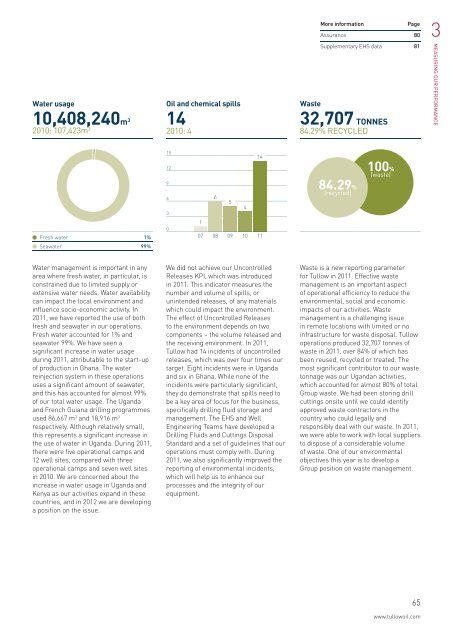
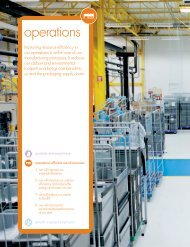
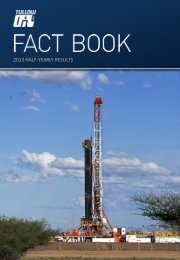
More informationPageAssurance 803Water usage10,408,240m 32010: 107,423m 3<strong>Oil</strong> and chemical spills142010: 4Supplementary EHS data 81Waste32,707 TONNES84.29% RECYCLEDMEASURING OUR PERFORMANCE151412100%(waste)96365484.29%(recycled)Fresh water 1%0107 08 09 10 11Seawater 99%Water management is important in anyarea where fresh water, in particular, isconstrained due to limited supply orextensive water needs. Water availabilitycan impact the local environment andinfluence socio-economic activity. In<strong>2011</strong>, we have reported the use of bothfresh and seawater in our operations.Fresh water accounted for 1% andseawater 99%. We have seen asignificant increase in water usageduring <strong>2011</strong>, attributable to the start-upof production in Ghana. <strong>The</strong> waterreinjection system in these operationsuses a significant amount of seawater,and this has accounted for almost 99%of our total water usage. <strong>The</strong> Ugandaand French Guiana drilling programmesused 86,667 m 3 and 18,916 m 3respectively. Although relatively small,this represents a significant increase inthe use of water in Uganda. During <strong>2011</strong>,there were five operational camps and12 well sites, compared with threeoperational camps and seven well sitesin 2010. We are concerned about theincrease in water usage in Uganda andKenya as our activities expand in thesecountries, and in <strong>2012</strong> we are developinga position on the issue.We did not achieve our UncontrolledReleases KPI, which was introducedin <strong>2011</strong>. This indicator measures thenumber and volume of spills, orunintended releases, of any materialswhich could impact the environment.<strong>The</strong> effect of Uncontrolled Releasesto the environment depends on twocomponents – the volume released andthe receiving environment. In <strong>2011</strong>,<strong>Tullow</strong> had 14 incidents of uncontrolledreleases, which was over four times ourtarget. Eight incidents were in Ugandaand six in Ghana. While none of theincidents were particularly significant,they do demonstrate that spills need tobe a key area of focus for the business,specifically drilling fluid storage andmanagement. <strong>The</strong> EHS and WellEngineering Teams have developed aDrilling Fluids and Cuttings DisposalStandard and a set of guidelines that ouroperations must comply with. During<strong>2011</strong>, we also significantly improved thereporting of environmental incidents,which will help us to enhance ourprocesses and the integrity of ourequipment.Waste is a new reporting parameterfor <strong>Tullow</strong> in <strong>2011</strong>. Effective wastemanagement is an important aspectof operational efficiency to reduce theenvironmental, social and economicimpacts of our activities. Wastemanagement is a challenging issuein remote locations with limited or noinfrastructure for waste disposal. <strong>Tullow</strong>operations produced 32,707 tonnes ofwaste in <strong>2011</strong>, over 84% of which hasbeen reused, recycled or treated. <strong>The</strong>most significant contributor to our wastetonnage was our Ugandan activities,which accounted for almost 80% of total<strong>Group</strong> waste. We had been storing drillcuttings onsite until we could identifyapproved waste contractors in thecountry who could legally andresponsibly deal with our waste. In <strong>2011</strong>,we were able to work with local suppliersto dispose of a considerable volumeof waste. One of our environmentalobjectives this year is to develop a<strong>Group</strong> position on waste management.65www.tullowoil.com