DRAFT LTP book.indb - Hurunui District Council
DRAFT LTP book.indb - Hurunui District Council
DRAFT LTP book.indb - Hurunui District Council

You also want an ePaper? Increase the reach of your titles
YUMPU automatically turns print PDFs into web optimized ePapers that Google loves.
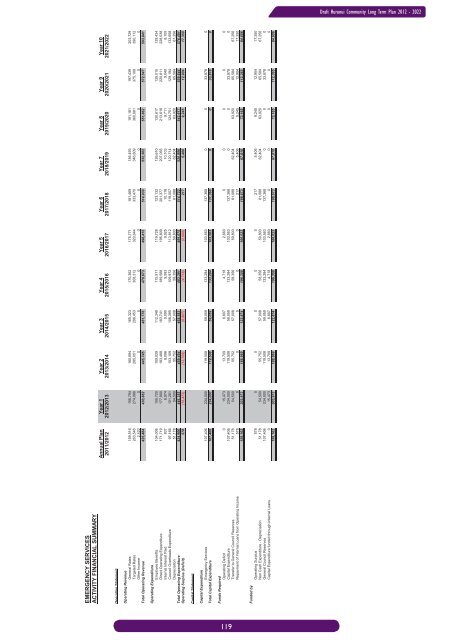
Draft <strong>Hurunui</strong> Community Long Term Plan 2012 - 2022EMERGENCY SERVICESACTIVITY FINANCIAL SUMMARYAnnual Plan Year 1 Year 2 Year 3 Year 4 Year 5 Year 6 Year 7 Year 8 Year 9 Year 102011/2012 2012/2013 2013/2014 2014/2015 2015/2016 2016/2017 2017/2018 2018/2019 2019/2020 2020/2021 2021/2022Operating StatementOperating RevenueGeneral Rates 159,516 156,794 160,694 165,323 170,362 175,771 181,469 185,493 191,181 197,439 203,729Targeted Rates 263,546 274,088 285,051 296,453 308,312 320,644 333,470 346,809 360,681 375,108 390,112Other Income 2,422 0 0 0 0 0 0 0 0 0 0Total Operating Revenue 425,484 430,882 445,745 461,776 478,673 496,415 514,939 532,302 551,862 572,547 593,841Operating ExpenditureEmployee Benefits 104,006 105,720 109,029 112,349 115,911 119,728 123,132 126,610 130,617 135,015 139,434Direct Operating Expenditure 171,719 177,900 183,468 183,741 189,568 195,809 201,377 207,065 213,618 220,811 228,038Internal Interest Paid 837 6,974 8,096 9,090 9,583 9,925 10,118 10,103 9,711 9,040 8,105<strong>Council</strong> Overheads Expenditure 97,166 101,261 103,109 106,395 109,972 113,812 119,007 120,714 124,751 129,194 133,658Depreciation 51,178 54,500 55,752 57,008 58,356 59,800 61,088 62,404 63,920 65,584 67,256Total Operating Expenditure 424,906 446,355 459,454 468,583 483,391 499,075 514,722 526,896 542,617 559,644 576,491Operating Surplus (Deficit) 578 (15,473) (13,709) (6,807) (4,718) (2,660) 217 5,406 9,245 12,904 17,350Capital StatementCapital ExpenditureEmergency Services 107,406 234,000 119,508 59,059 133,284 103,563 137,368 0 0 33,878 0Total Capital Expenditure 107,406 234,000 119,508 59,059 133,284 103,563 137,368 0 0 33,878 0Funds RequiredOperating Deficit 0 15,473 13,709 6,807 4,718 2,660 0 0 0 0 0Capital Expenditure 107,406 234,000 119,508 59,059 133,284 103,563 137,368 0 0 33,878 0Transfer to General <strong>Council</strong> Reserves 51,178 54,500 55,752 57,008 58,356 59,800 61,088 62,404 63,920 65,584 67,256Repayment of Internal Loans from Operating Income 578 0 0 0 0 0 217 5,406 9,245 12,904 17,350159,162 303,973 188,969 122,874 196,358 166,023 198,673 67,810 73,165 112,365 84,606Funded byOperating Surplus 578 0 0 0 0 0 217 5,406 9,245 12,904 17,350Non Cash Expenditure - Depreciation 51,178 54,500 55,752 57,008 58,356 59,800 61,088 62,404 63,920 65,584 67,256General <strong>Council</strong> Reserves 107,406 234,000 119,508 59,059 133,284 103,563 137,368 0 0 33,878 0Capital Expenditure funded through Internal Loans 0 15,473 13,709 6,807 4,718 2,660 0 0 0 0 0159,162 303,973 188,969 122,874 196,358 166,023 198,673 67,810 73,165 112,365 84,606119