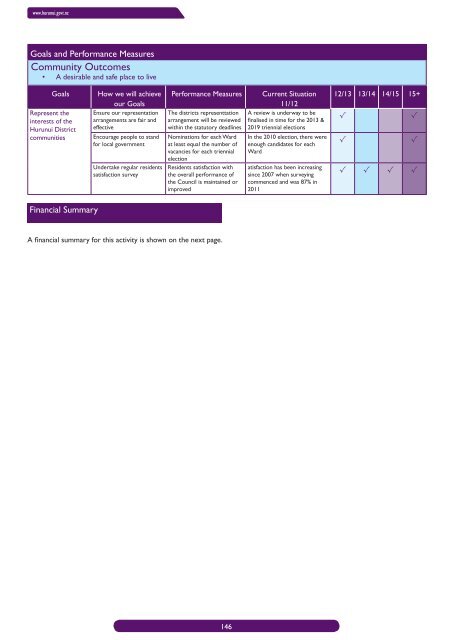
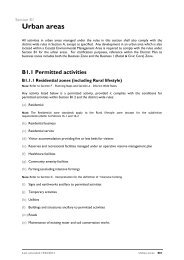
www.hurunui.govt.nzGoals and Performance MeasuresCommunity Outcomes• A desirable and safe place to liveGoalsRepresent theinterests of the<strong>Hurunui</strong> <strong>District</strong>communitiesHow we will achieveour GoalsEnsure our representationarrangements are fair andeffectiveEncourage people to standfor local governmentUndertake regular residentssatisfaction surveyPerformance MeasuresThe districts representtationarrangement will be reviewedwithin the statutory deadlinesNominations for each Wardat least equal the number ofvacancies for each triennialelectionResidents satisfaction withthe overall performance ofthe <strong>Council</strong> is maintained orimprovedCurrent Situation11/12A review is underway to befi nalised in time for the 2013 &2019 triennial electionsIn the 2010 election, there wereenough candidates for eachWardatisfaction has been increasingsince 2007 when surveyingcommenced and was 87% in201112/13 13/14 14/15 15+√√√√√ √ √ √Financial SummaryA fi nancial summary for this activity is shown on the next page.146
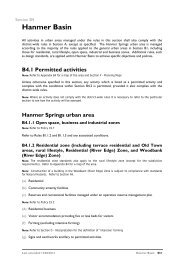
Draft <strong>Hurunui</strong> Community Long Term Plan 2012 - 2022GOVERNANCEGROUP ACTIVITY FINANCIAL SUMMARYAnnual Plan Year 1 Year 2 Year 3 Year 4 Year 5 Year 6 Year 7 Year 8 Year 9 Year 102011/2012 2012/2013 2013/2014 2014/2015 2015/2016 2016/2017 2017/2018 2018/2019 2019/2020 2020/2021 2021/2022Operating StatementOperating RevenueGeneral Rates 882,226 1,016,941 1,050,685 1,126,491 1,093,148 1,182,526 1,272,951 1,200,456 1,271,771 1,368,459 1,330,235Other Income 28,000 16,000 16,501 17,003 17,542 18,120 18,635 19,162 19,768 20,434 21,102Total Operating Revenue 910,226 1,032,941 1,067,185 1,143,494 1,110,690 1,200,646 1,291,586 1,219,618 1,291,539 1,388,893 1,351,337Operating ExpenditureEmployee Benefits 362,270 446,554 460,531 474,553 489,601 505,722 520,101 534,793 551,717 570,294 588,960Direct Operating Expenditure 281,936 229,600 262,569 313,071 251,733 310,985 343,121 274,969 314,558 376,234 302,819<strong>Council</strong> Overheads Expenditure 266,020 350,788 338,086 349,870 363,355 377,939 422,365 403,856 419,264 436,365 453,558Depreciation 0 6,000 6,000 6,000 6,000 6,000 6,000 6,000 6,000 6,000 6,000Total Operating Expenditure 910,226 1,032,941 1,067,185 1,143,494 1,110,690 1,200,646 1,291,586 1,219,618 1,291,539 1,388,893 1,351,337Operating Surplus (Deficit) 0 0 0 0 0 0 0 0 0 0 0Capital StatementCapital ExpenditureGovernance 0 0 25,980 0 0 28,768 0 0 32,398 0 0Total Capital Expenditure 0 0 25,980 0 0 28,768 0 0 32,398 0 0Funds RequiredCapital Expenditure 0 0 25,980 0 0 28,768 0 0 32,398 0 0Transfer to General <strong>Council</strong> Reserves 0 6,000 6,000 6,000 6,000 6,000 6,000 6,000 6,000 6,000 6,0000 6,000 31,980 6,000 6,000 34,768 6,000 6,000 38,398 6,000 6,000Funded byNon Cash Expenditure - Depreciation 0 6,000 6,000 6,000 6,000 6,000 6,000 6,000 6,000 6,000 6,000General <strong>Council</strong> Reserves 0 0 25,980 0 0 28,768 0 0 32,398 0 00 6,000 31,980 6,000 6,000 34,768 6,000 6,000 38,398 6,000 6,000147