DRAFT LTP book.indb - Hurunui District Council
DRAFT LTP book.indb - Hurunui District Council
DRAFT LTP book.indb - Hurunui District Council

Create successful ePaper yourself
Turn your PDF publications into a flip-book with our unique Google optimized e-Paper software.
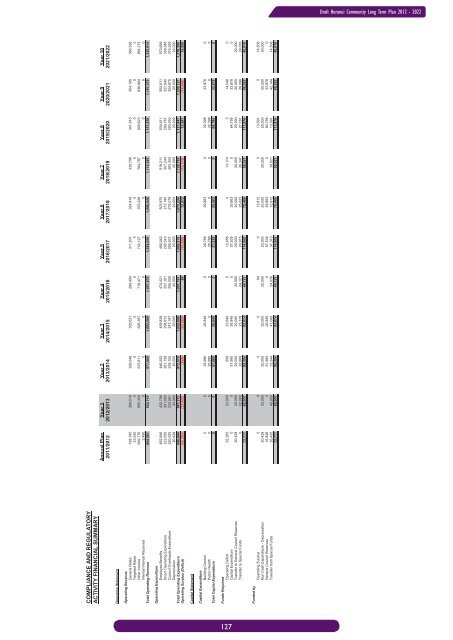
Draft <strong>Hurunui</strong> Community Long Term Plan 2012 - 2022COMPLIANCE AND REGULATORYACTIVITY FINANCIAL SUMMARYAnnual Plan Year 1 Year 2 Year 3 Year 4 Year 5 Year 6 Year 7 Year 8 Year 9 Year 102011/2012 2012/2013 2013/2014 2014/2015 2015/2016 2016/2017 2017/2018 2018/2019 2019/2020 2020/2021 2021/2022Operating StatementOperating RevenueGeneral Rates 168,765 269,019 296,048 305,621 289,404 311,931 324,818 330,798 341,915 354,195 366,538Targeted Rates 23,530 0 0 0 0 0 0 0 0 0 0Other Income 699,776 655,300 675,811 696,387 718,471 742,127 763,228 784,787 809,623 836,884 864,275Internal Interest Received 2,490 0 0 0 0 0 0 0 0 0 0Total Operating Revenue 894,561 924,319 971,859 1,002,008 1,007,875 1,054,058 1,088,046 1,115,585 1,151,538 1,191,079 1,230,814Operating ExpenditureEmployee Benefits 482,846 432,708 446,252 459,839 474,421 490,042 503,975 518,211 534,611 552,611 570,699Direct Operating Expenditure 223,550 261,050 267,158 298,672 257,161 290,543 273,180 307,244 289,787 327,640 309,348<strong>Council</strong> Overheads Expenditure 220,020 233,561 239,105 247,187 256,209 265,931 278,079 283,303 293,550 304,875 316,259Depreciation 20,428 20,000 20,000 20,000 20,000 20,000 20,000 20,000 20,000 20,000 20,000Total Operating Expenditure 946,844 947,319 972,515 1,025,698 1,007,791 1,066,515 1,075,234 1,128,759 1,137,947 1,205,127 1,216,306Operating Surplus (Deficit) (52,283) (23,000) (656) (23,690) 84 (12,458) 12,812 (13,174) 13,591 (14,048) 14,508Capital StatementCapital ExpenditureBuilding Control 0 0 25,980 26,845 0 28,768 29,863 0 32,398 33,878 0Public Health 0 0 25,980 0 0 28,768 0 0 32,398 0 0Total Capital Expenditure 0 0 51,960 26,845 0 57,535 29,863 0 64,795 33,878 0Funds RequiredOperating Deficit 52,283 23,000 656 23,690 0 12,458 0 13,174 0 14,048 0Capital Expenditure 0 0 51,960 26,845 0 57,535 29,863 0 64,795 33,878 0Transfer to General <strong>Council</strong> Reserves 20,428 20,000 20,000 20,000 20,000 20,000 20,000 20,000 20,000 20,000 20,000Transfer to Special Funds 0 22,000 22,689 23,379 24,121 24,915 25,623 26,347 27,181 28,096 29,01672,711 65,000 95,304 93,914 44,121 114,908 75,486 59,521 111,976 96,022 49,016Funded byOperating Surplus 0 0 0 0 84 0 12,812 0 13,591 0 14,508Non Cash Expenditure - Depreciation 20,428 20,000 20,000 20,000 20,000 20,000 20,000 20,000 20,000 20,000 20,000General <strong>Council</strong> Reserves 16,848 0 51,960 26,845 0 57,535 29,863 0 64,795 33,878 0Transfer from Special Funds 35,435 45,000 23,344 47,069 24,036 37,373 12,812 39,521 13,591 42,144 14,50872,711 65,000 95,304 93,914 44,121 114,908 75,486 59,521 111,976 96,022 49,016127