DRAFT LTP book.indb - Hurunui District Council
DRAFT LTP book.indb - Hurunui District Council
DRAFT LTP book.indb - Hurunui District Council

Create successful ePaper yourself
Turn your PDF publications into a flip-book with our unique Google optimized e-Paper software.
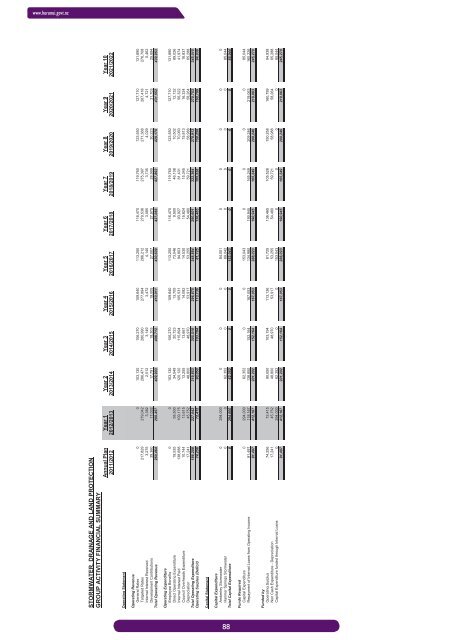
www.hurunui.govt.nzSTORMWATER, DRAINAGE AND LAND PROTECTIONGROUP ACTIVITY FINANCIAL SUMMARYAnnual Plan Year 1 Year 2 Year 3 Year 4 Year 5 Year 6 Year 7 Year 8 Year 9 Year 102011/2012 2012/2013 2013/2014 2014/2015 2015/2016 2016/2017 2017/2018 2018/2019 2019/2020 2020/2021 2021/2022Operating StatementOperating RevenueGeneral Rates 0 0 103,130 106,270 109,640 113,250 116,470 119,760 123,550 127,710 131,890Targeted Rates 217,829 279,042 286,471 280,990 277,894 286,212 279,536 275,397 271,368 267,418 276,708Internal Interest Received 3,275 3,382 2,512 3,149 3,472 4,140 3,085 3,735 4,029 4,721 5,462Development Contributions 39,360 17,032 17,791 18,303 19,005 27,007 27,975 28,999 30,223 31,703 25,894Total Operating Revenue 260,464 299,457 409,903 408,712 410,011 430,609 427,066 427,892 429,170 431,552 439,953Operating ExpenditureEmployee Benefits 0 0 103,130 106,270 109,640 113,250 116,470 119,760 123,550 127,710 131,890Direct Operating Expenditure 19,535 58,500 34,549 20,723 13,705 73,046 9,900 46,108 10,502 12,132 89,026Internal Interest Paid 138,688 109,175 120,120 115,894 105,531 94,803 93,927 81,431 70,060 56,322 41,974<strong>Council</strong> Overheads Expenditure 10,744 13,615 13,255 13,661 14,082 14,530 15,824 15,345 15,813 16,324 16,837Depreciation 17,241 45,752 48,800 48,970 53,917 53,255 54,480 59,721 58,988 58,264 65,288Total Operating Expenditure 186,208 227,042 319,853 305,518 296,875 348,884 290,601 322,364 278,913 270,753 345,015Operating Surplus (Deficit) 74,256 72,415 90,050 103,194 113,136 81,725 136,465 105,528 150,258 160,799 94,938Capital StatementCapital ExpenditureAmberley Stormwater 0 294,000 0 0 0 84,001 0 0 0 0 0Hanmer Springs Stormwater 0 0 62,352 0 0 69,042 0 0 0 0 85,044Total Capital Expenditure 0 294,000 62,352 0 0 153,043 0 0 0 0 85,044Funds RequiredCapital Expenditure 0 294,000 62,352 0 0 153,043 0 0 0 0 85,044Repayment of Internal Loans from Operating Income 91,497 118,167 138,850 152,164 167,053 134,980 190,945 165,249 209,246 219,063 160,22691,497 412,167 201,202 152,164 167,053 288,023 190,945 165,249 209,246 219,063 245,270Funded byOperating Surplus 74,256 72,415 90,050 103,194 113,136 81,725 136,465 105,528 150,258 160,799 94,938Non Cash Expenditure - Depreciation 17,241 45,752 48,800 48,970 53,917 53,255 54,480 59,721 58,988 58,264 65,288Capital Expenditure funded through Internal Loans 0 294,000 62,352 0 0 153,043 0 0 0 0 85,04491,497 412,167 201,202 152,164 167,053 288,023 190,945 165,249 209,246 219,063 245,27088