
You also want an ePaper? Increase the reach of your titles
YUMPU automatically turns print PDFs into web optimized ePapers that Google loves.
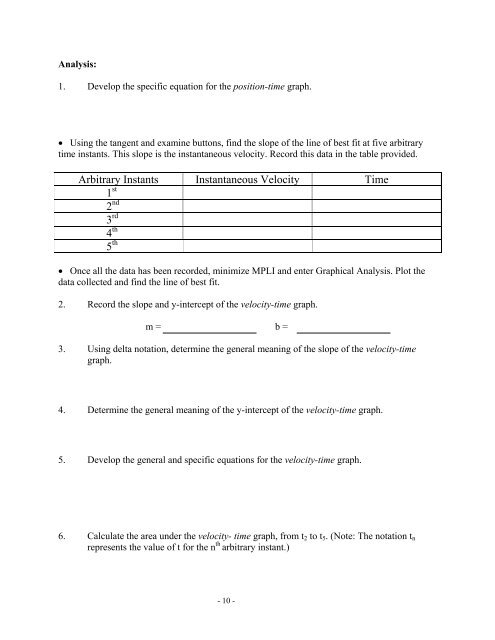
Analysis:1. Develop the specific equation for the position-time graph.• Using the tangent and examine buttons, find the slope of the line of best fit at five arbitrarytime instants. This slope is the instantaneous velocity. Record this data in the table provided.Arbitrary Instants Instantaneous Velocity Time1 st2 nd3 rd4 th5 th• Once all the data has been recorded, minimize MPLI and enter Graphical Analysis. Plot thedata collected and find the line of best fit.2. Record the slope and y-intercept of the velocity-time graph.m = b =3. Using delta notation, determine the general meaning of the slope of the velocity-timegraph.4. Determine the general meaning of the y-intercept of the velocity-time graph.5. Develop the general and specific equations for the velocity-time graph.6. Calculate the area under the velocity- time graph, from t 2 to t 5 . (Note: The notation t nrepresents the value of t for the n th arbitrary instant.)- 10 -