
You also want an ePaper? Increase the reach of your titles
YUMPU automatically turns print PDFs into web optimized ePapers that Google loves.
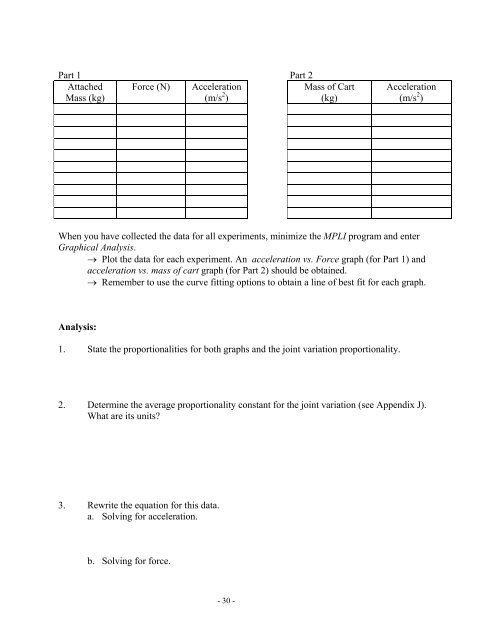
Part 1 Part 2Attached Force (N) AccelerationMass of CartMass (kg)(m/s 2 )(kg)Acceleration(m/s 2 )When you have collected the data for all experiments, minimize the MPLI program and enterGraphical Analysis.→ Plot the data for each experiment. An acceleration vs. Force graph (for Part 1) andacceleration vs. mass of cart graph (for Part 2) should be obtained.→ Remember to use the curve fitting options to obtain a line of best fit for each graph.Analysis:1. State the proportionalities for both graphs and the joint variation proportionality.2. Determine the average proportionality constant for the joint variation (see Appendix J).What are its units?3. Rewrite the equation for this data.a. Solving for acceleration.b. Solving for force.- 30 -