You also want an ePaper? Increase the reach of your titles
YUMPU automatically turns print PDFs into web optimized ePapers that Google loves.
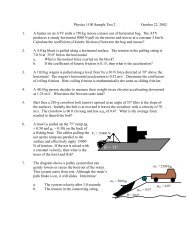
Analysis:1. What does the slope of each graph represent?2. Calculate the velocity of the “circle” ship with respect to the “rectangle” ship in this 2-Dsituation as you did in the 1-D situation. [Hint: Consider vector analysis.]3. Suppose you were on the bridge of the ”rectangle” ship. According to your observation,how and in which direction does the other ship appear to be moving? (Consider how theseparation displacement is changing with time.)4. Suppose you were on the “circle” ship instead. How would the motion of the “rectangle”ship appear? (Consider both magnitude and direction.)→ To check your answers for #3 and #4 return to the simulation. It is possible torun the simulation while using one of the objects as a frame of reference. Thatis, the simulation will now be seen from the point-of-view of the chosenobject.→ click on the "rectangle" ship→ enter View → New Reference Frame → (the object name shouldappear and the "show eyeball" should be turned on) → click Ok→ run the simulation and note that the rectangle now appears fixedwhile the circle and XY axes are in motion.→ repeat for the "circle" ship→ to return to the original reference frame enter View → Home→ to reset the window widthenter View → View Size → Window Width → 25 m- 25 -