- Page 1 and 2:
Final ReportPilot Project - Phase1C
- Page 4 and 5:
Tuning EducationalStructures in Eur
- Page 6 and 7:
List of ParticipantsJoint General C
- Page 8 and 9:
—Universität Göttingen - Matthi
- Page 10 and 11:
—Universitá degli Studi di Bolog
- Page 12 and 13:
Map of the Tuning Member Institutio
- Page 14 and 15:
ContentPART ONEPreliminary Remarks
- Page 16:
PART ONE
- Page 19 and 20:
generous financial support but also
- Page 21 and 22:
Transfer and Accumulation System (E
- Page 23 and 24:
By learning outcomes we mean the se
- Page 25 and 26:
—To create European networks able
- Page 27 and 28:
The provision of reference points a
- Page 29 and 30: transmission of knowledge. Elements
- Page 31 and 32: enhancement of mobility, not only o
- Page 33 and 34: of a second language, ability to co
- Page 35 and 36: —show understanding and implement
- Page 37 and 38: study. As part of this phase each o
- Page 39 and 40: does not imply that it is not possi
- Page 41 and 42: academics the opportunity to exchan
- Page 43 and 44: elationship between educational str
- Page 45 and 46: —ECTS as a Europe-wide accumulati
- Page 47 and 48: outside the framework of a programm
- Page 49 and 50: If the aims of Universities come to
- Page 52 and 53: General Conclusionsand Recommendati
- Page 54: subject areas. Because of these rea
- Page 58: LINE 1Generic Competences
- Page 61 and 62: consultations are important. It fur
- Page 63 and 64: organization of learning. Each of t
- Page 65 and 66: In fact, the relationship between r
- Page 67 and 68: 5.1. The objectivesThe objectives o
- Page 69 and 70: eformulation, these general skills
- Page 71 and 72: In April, 2001 a draft of the first
- Page 73 and 74: —Questionnaire for Graduates:•
- Page 75 and 76: IMPORTANCEConcentration+ -Low Prior
- Page 77 and 78: The aim of both questionnaires was,
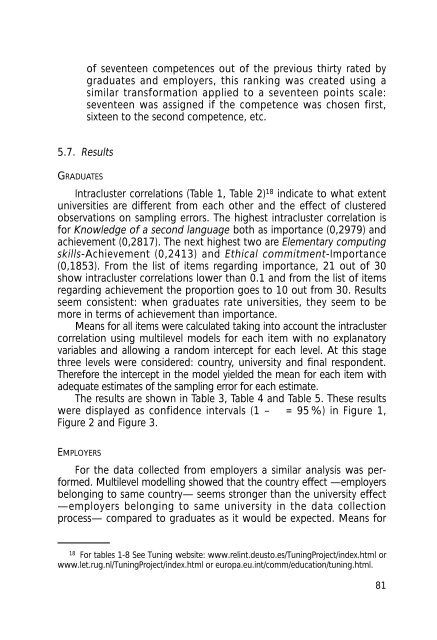
- Page 79: error of any estimate produced. The
- Page 83 and 84: GraduatesEmployersLabel Description
- Page 85 and 86: ACADEMICSThe academics were asked t
- Page 87 and 88: The most striking difference is tha
- Page 89 and 90: skills in the definition and develo
- Page 91 and 92: subject-related competences for the
- Page 93 and 94: —However, in relation to the issu
- Page 95 and 96: GOLDSTEIN, H. and SPIEGELHALTER, D.
- Page 97 and 98: THE QUALITY ASSURANCE AGENCY FOR HI
- Page 100 and 101: Business Subject Area Group:Subject
- Page 102 and 103: KnowledgeAcquisitionand WideningCor
- Page 104 and 105: CycleModuleFirst First Second Secon
- Page 106 and 107: CycleModuleFirst First Second Secon
- Page 108 and 109: Modules: Knowledge deepening (Verti
- Page 110 and 111: Chemistry Subject Area Group:The Ch
- Page 112 and 113: It must be made clear at the outset
- Page 114 and 115: —The structural features of chemi
- Page 116 and 117: probably requiring 15 credits. Thus
- Page 118 and 119: large proportion of his studies on
- Page 120 and 121: Attainment Level a (highest):—Kno
- Page 122: the framework necessary to provide
- Page 125 and 126: A second preliminary remark will re
- Page 127 and 128: —teaching/learning material, and
- Page 129 and 130: Against this background and followi
- Page 131 and 132:
Despite the many differences specif
- Page 133 and 134:
As regards secondary level teacher
- Page 135 and 136:
and/or modules that could meet the
- Page 137 and 138:
The only possible aim to agree on a
- Page 139 and 140:
2. Programmes, knowledge and skills
- Page 141 and 142:
investigations for civil engineerin
- Page 143 and 144:
—collecting, recording and analys
- Page 145 and 146:
4. Performance levelsIn this sectio
- Page 147 and 148:
eceive a History degree. (In some c
- Page 149 and 150:
—The group underlines particularl
- Page 151 and 152:
obvious that the first principle is
- Page 153 and 154:
or broader world history. Mapping t
- Page 155 and 156:
ANNEX 1Proposed Formulation in gene
- Page 157 and 158:
ANNEX 2List of Subject Specific Ski
- Page 160 and 161:
Mathematics Subject Area Group:Towa
- Page 162 and 163:
a) He/she will be legally recognise
- Page 164 and 165:
—a list of contents;—a list of
- Page 166 and 167:
knowledge will commonly be designed
- Page 168:
5. A common framework and the Bolog
- Page 171 and 172:
Physics Network. They relied on som
- Page 173 and 174:
The rating values can be ordered in
- Page 175 and 176:
Table 3Competences ordered by impor
- Page 177 and 178:
attitude is confirmed by the result
- Page 179 and 180:
Table 4Competences ordered by «gap
- Page 181 and 182:
oth physics degrees. It is a kind o
- Page 183 and 184:
2 puzzling aspects, related to some
- Page 185 and 186:
elow), the final year thesis work,
- Page 187 and 188:
connection, the Socrates Thematic N
- Page 189 and 190:
Of course the core content can be f
- Page 191 and 192:
Table 2Correspondence between the e
- Page 193 and 194:
Some further clarifying remarks are
- Page 195 and 196:
The main point here is that the com
- Page 197 and 198:
In Fig. 3 we present the common cre
- Page 199 and 200:
ANNEX 1 (first part)Institutions wi
- Page 201 and 202:
ANNEX IIThe Common Core Content of
- Page 203 and 204:
Table IEUPEN WG2 Questionnaire - Ma
- Page 205 and 206:
A first general remark concerns the
- Page 207 and 208:
involved cycle. These latter number
- Page 209 and 210:
enough there are no great differenc
- Page 212:
Line 3New Perspectives on ECTSas an
- Page 215 and 216:
functions, is necessary. Together w
- Page 217 and 218:
—Allow transference with other no
- Page 219 and 220:
statements that provide a general g
- Page 221 and 222:
PRAGUE COMMUNIQUÉ (2001). Prague C
- Page 223 and 224:
importance of a subject or the numb
- Page 225 and 226:
0. IntroductionThis paper aims to o
- Page 227 and 228:
1.2. Relative and absolute value of
- Page 229 and 230:
e included in their own degree prog
- Page 231 and 232:
misunderstanding occurred about the
- Page 233 and 234:
The subject related theoretical and
- Page 235 and 236:
In any kind of system, modular or n
- Page 237 and 238:
pre-condition for such a European w
- Page 239 and 240:
learning time is the number of hour
- Page 241 and 242:
25 to 30 hours of student workload.
- Page 243 and 244:
from institution to institution and
- Page 245 and 246:
for today’s student. It implies t
- Page 247 and 248:
the Tuning project that if the next
- Page 249 and 250:
—The difference in terms of the t
- Page 252:
Glossary, WWW Goldmineand Appendixe
- Page 255 and 256:
Comprehensive examASSESSMENT of the
- Page 257 and 258:
THESIS. It is generally referred to
- Page 259 and 260:
MarkAny numerical or qualitative sc
- Page 261 and 262:
WorkloadAll learning activities req
- Page 263 and 264:
— European Network for Quality As
- Page 265 and 266:
— Big Business und Big Bang. Beru
- Page 267 and 268:
Newsletter— Education and Culture
- Page 270:
Appendix IQuestionnaires used
- Page 273 and 274:
6. Do you feel that the education y
- Page 275 and 276:
Level to whichSkill/Competence Impo
- Page 277 and 278:
Questionnaire for academicsRanking
- Page 279 and 280:
BusinessQuestionnaire for academics
- Page 281 and 282:
ChemistryQuestionnaire for academic
- Page 283 and 284:
Specific Competences26. Study skill
- Page 285 and 286:
Specific CompetencesImportance Impo
- Page 287 and 288:
Specific Competences14. Receiving a
- Page 289 and 290:
Specific Competences34. Ability to
- Page 291 and 292:
MathematicsQuestionnaire for academ
- Page 293 and 294:
PhysicsQuestionnaire for academicsS
- Page 295 and 296:
Specific Competences55. Be able to
- Page 298:
Appendix IILength of Studies
- Page 301 and 302:
Present/ForeseenCountry Subject Are
- Page 303 and 304:
Present/ForeseenCountry Subject Are
- Page 305 and 306:
Present/ForeseenCountry Subject Are
- Page 307 and 308:
Present/ForeseenCountry Subject Are
- Page 309 and 310:
Present/ForeseenCountry Subject Are
- Page 311 and 312:
Present/ForeseenCountry Subject Are
- Page 313 and 314:
Present/ForeseenCountry Subject Are
- Page 315 and 316:
Present/ForeseenCountry Subject Are