Annual Report 2012
Annual Report 2012
Annual Report 2012
You also want an ePaper? Increase the reach of your titles
YUMPU automatically turns print PDFs into web optimized ePapers that Google loves.
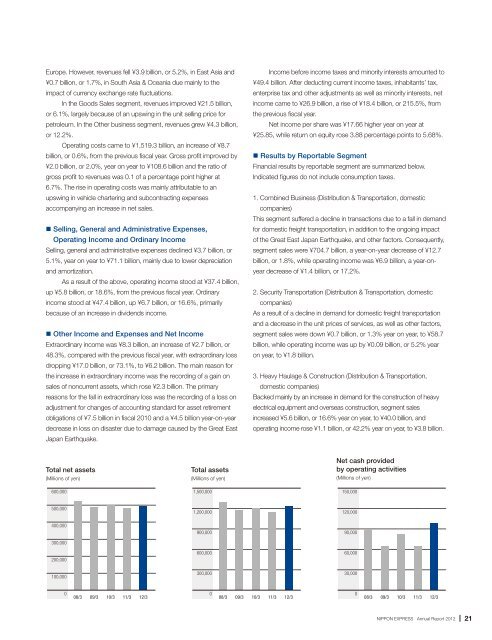
Europe. However, revenues fell ¥3.9 billion, or 5.2%, in East Asia and¥0.7 billion, or 1.7%, in South Asia & Oceania due mainly to theimpact of currency exchange rate fluctuations.In the Goods Sales segment, revenues improved ¥21.5 billion,or 6.1%, largely because of an upswing in the unit selling price forpetroleum. In the Other business segment, revenues grew ¥4.3 billion,or 12.2%.Operating costs came to ¥1,519.3 billion, an increase of ¥8.7billion, or 0.6%, from the previous fiscal year. Gross profit improved by¥2.0 billion, or 2.0%, year on year to ¥108.6 billion and the ratio ofgross profit to revenues was 0.1 of a percentage point higher at6.7%. The rise in operating costs was mainly attributable to anupswing in vehicle chartering and subcontracting expensesaccompanying an increase in net sales.• Selling, General and Administrative Expenses,Operating Income and Ordinary IncomeSelling, general and administrative expenses declined ¥3.7 billion, or5.1%, year on year to ¥71.1 billion, mainly due to lower depreciationand amortization.As a result of the above, operating income stood at ¥37.4 billion,up ¥5.8 billion, or 18.6%, from the previous fiscal year. Ordinaryincome stood at ¥47.4 billion, up ¥6.7 billion, or 16.6%, primarilybecause of an increase in dividends income.• Other Income and Expenses and Net IncomeExtraordinary income was ¥8.3 billion, an increase of ¥2.7 billion, or48.3%, compared with the previous fiscal year, with extraordinary lossdropping ¥17.0 billion, or 73.1%, to ¥6.2 billion. The main reason forthe increase in extraordinary income was the recording of a gain onsales of noncurrent assets, which rose ¥2.3 billion. The primaryreasons for the fall in extraordinary loss was the recording of a loss onadjustment for changes of accounting standard for asset retirementobligations of ¥7.5 billion in fiscal 2010 and a ¥4.5 billion year-on-yeardecrease in loss on disaster due to damage caused by the Great EastJapan Earthquake.Income before income taxes and minority interests amounted to¥49.4 billion. After deducting current income taxes, inhabitants’ tax,enterprise tax and other adjustments as well as minority interests, netincome came to ¥26.9 billion, a rise of ¥18.4 billion, or 215.5%, fromthe previous fiscal year.Net income per share was ¥17.66 higher year on year at¥25.85, while return on equity rose 3.88 percentage points to 5.68%.• Results by <strong>Report</strong>able SegmentFinancial results by reportable segment are summarized below.Indicated figures do not include consumption taxes.1. Combined Business (Distribution & Transportation, domesticcompanies)This segment suffered a decline in transactions due to a fall in demandfor domestic freight transportation, in addition to the ongoing impactof the Great East Japan Earthquake, and other factors. Consequently,segment sales were ¥704.7 billion, a year-on-year decrease of ¥12.7billion, or 1.8%, while operating income was ¥6.9 billion, a year-onyeardecrease of ¥1.4 billion, or 17.2%.2. Security Transportation (Distribution & Transportation, domesticcompanies)As a result of a decline in demand for domestic freight transportationand a decrease in the unit prices of services, as well as other factors,segment sales were down ¥0.7 billion, or 1.3% year on year, to ¥58.7billion, while operating income was up by ¥0.09 billion, or 5.2% yearon year, to ¥1.8 billion.3. Heavy Haulage & Construction (Distribution & Transportation,domestic companies)Backed mainly by an increase in demand for the construction of heavyelectrical equipment and overseas construction, segment salesincreased ¥5.6 billion, or 16.6% year on year, to ¥40.0 billion, andoperating income rose ¥1.1 billion, or 42.2% year on year, to ¥3.8 billion.Total net assets(Millions of yen)600,000Total assets(Millions of yen)1,500,000Net cash providedby operating activities(Millions of yen)150,000500,0001,200,000120,000400,000300,000200,000900,000600,00090,00060,000100,000300,00030,000008/3 09/3 10/3 11/3 12/3008/3 09/3 10/3 11/3 12/3008/3 09/3 10/3 11/312/3NIPPON EXPRESS <strong>Annual</strong> <strong>Report</strong> <strong>2012</strong>21


![Business Report for the 102nd Term [PDF 718KB] - Nippon Express](https://img.yumpu.com/46285896/1/184x260/business-report-for-the-102nd-term-pdf-718kb-nippon-express.jpg?quality=85)
![CSR Report 2010 [PDF 5764KB] - Nippon Express](https://img.yumpu.com/45662405/1/184x260/csr-report-2010-pdf-5764kb-nippon-express.jpg?quality=85)


