(1) Consolidated Financial StatementsConsolidated Statements of Changes in Net AssetsNippon Express Co., Ltd. and consolidated subsidiariesFor the years ended March 31, 2011 and <strong>2012</strong>Thousands ofMillions of yen U.S. dollars2011 <strong>2012</strong> <strong>2012</strong>Shareholders’ equityCommon stockBalance at beginning of the year ¥ 70,175 ¥ 70,175 $ 853,817Total changes during the year — — —Balance at end of the year 70,175 70,175 853,817Additional paid-in capitalBalance at beginning of the year 26,908 26,908 327,390Total changes during the year — — —Balance at end of the year 26,908 26,908 327,390Retained earningsBalance at beginning of the year 377,675 375,785 4,572,152Changes during the year:Cash dividends (10,427) (10,427) (126,868)Net income 8,541 26,949 327,889Decrease in treasury stock (3) (1) (23)Total changes during the year (1,889) 16,519 200,997Balance at end of the year 375,785 392,305 4,773,149Treasury stockBalance at beginning of the year (11,524) (11,542) (140,434)Changes during the year:Increase in treasury stock (26) (11) (139)Decrease in treasury stock 8 4 50Total changes during the year (17) (7) (88)Balance at end of the year (11,542) (11,549) (140,523)Total shareholders’ equityBalance at beginning of the year 463,234 461,326 5,612,925Changes during the year:Cash dividends (10,427) (10,427) (126,868)Net income 8,541 26,949 327,889Increase in treasury stock (26) (11) (139)Decrease in treasury stock 4 2 27Total changes during the year (1,907) 16,512 200,908Balance at end of the year ¥ 461,326 ¥ 477,839 $ 5,813,834Thousands ofMillions of yen U.S. dollars2011 <strong>2012</strong> <strong>2012</strong>Accumulated other comprehensiveincomeValuation difference on availablefor-salesecuritiesBalance at beginning of the year 33,248 26,370 320,851Net changes in items otherthan shareholders’ equity (6,877) 1,386 16,864Total changes during the year (6,877) 1,386 16,864Balance at end of the year 26,370 27,756 337,716Deferred gains (losses) onhedgesBalance at beginning of the year 12 9 121Net changes in items otherthan shareholders’ equity (2) (1) (22)Total changes during the year (2) (1) (22)Balance at end of the year 9 8 98Foreign currency translationadjustmentsBalance at beginning of the year (12,241) (20,255) (246,450)Net changes in items otherthan shareholders’ equity (8,014) (4,001) (48,682)Total changes during the year (8,014) (4,001) (48,682)Balance at end of the year (20,255) (24,256) (295,132)Total accumulated othercomprehensive incomeBalance at beginning of the year 21,019 6,125 74,522Net changes in items otherthan shareholders’ equity (14,894) (2,616) (31,840)Total changes during the year (14,894) (2,616) (31,840)Balance at end of the year 6,125 3,508 42,682Minority interestsBalance at beginning of the year 11,629 12,446 151,439Net changes in items otherthan shareholders’ equity 817 411 5,005Total changes during the year 817 411 5,005Balance at end of the year 12,446 12,858 156,444Total net assetsBalance at beginning of the year 495,893 479,848 5,838,887Changes during the year:Cash dividends (10,427) (10,427) (126,868)Net income 8,541 26,949 327,889Increase in treasury stock (26) (11) (139)Decrease in treasury stock 4 2 27Net changes in items otherthan shareholders’ equity (14,077) (2,205) (26,835)Total changes during the year (15,985) 14,307 174,073Balance at end of the year ¥479,898 ¥494,205 $6,012,961The accompanying notes are an integral part of these statements.30 NIPPON EXPRESS <strong>Annual</strong> <strong>Report</strong> <strong>2012</strong>
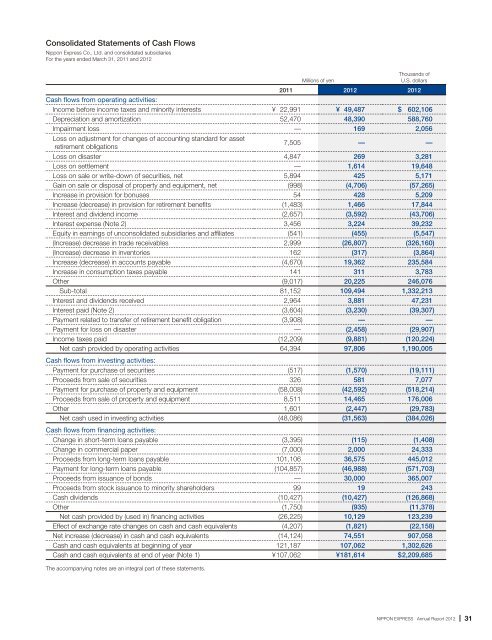
Consolidated Statements of Cash FlowsNippon Express Co., Ltd. and consolidated subsidiariesFor the years ended March 31, 2011 and <strong>2012</strong>Thousands ofMillions of yenU.S. dollars2011 <strong>2012</strong> <strong>2012</strong>Cash flows from operating activities:Income before income taxes and minority interests ¥ 22,991 ¥ 49,487 $ 602,106Depreciation and amortization 52,470 48,390 588,760Impairment loss — 169 2,056Loss on adjustment for changes of accounting standard for assetretirement obligations7,505 — —Loss on disaster 4,847 269 3,281Loss on settlement — 1,614 19,648Loss on sale or write-down of securities, net 5,894 425 5,171Gain on sale or disposal of property and equipment, net (998) (4,706) (57,265)Increase in provision for bonuses 54 428 5,209Increase (decrease) in provision for retirement benefits (1,483) 1,466 17,844Interest and dividend income (2,657) (3,592) (43,706)Interest expense (Note 2) 3,456 3,224 39,232Equity in earnings of unconsolidated subsidiaries and affiliates (541) (455) (5,547)(Increase) decrease in trade receivables 2,999 (26,807) (326,160)(Increase) decrease in inventories 162 (317) (3,864)Increase (decrease) in accounts payable (4,670) 19,362 235,584Increase in consumption taxes payable 141 311 3,783Other (9,017) 20,225 246,076Sub-total 81,152 109,494 1,332,213Interest and dividends received 2,964 3,881 47,231Interest paid (Note 2) (3,604) (3,230) (39,307)Payment related to transfer of retirement benefit obligation (3,908) — —Payment for loss on disaster — (2,458) (29,907)Income taxes paid (12,209) (9,881) (120,224)Net cash provided by operating activities 64,394 97,806 1,190,005Cash flows from investing activities:Payment for purchase of securities (517) (1,570) (19,111)Proceeds from sale of securities 326 581 7,077Payment for purchase of property and equipment (58,008) (42,592) (518,214)Proceeds from sale of property and equipment 8,511 14,465 176,006Other 1,601 (2,447) (29,783)Net cash used in investing activities (48,086) (31,563) (384,026)Cash flows from financing activities:Change in short-term loans payable (3,395) (115) (1,408)Change in commercial paper (7,000) 2,000 24,333Proceeds from long-term loans payable 101,106 36,575 445,012Payment for long-term loans payable (104,857) (46,988) (571,703)Proceeds from issuance of bonds — 30,000 365,007Proceeds from stock issuance to minority shareholders 99 19 243Cash dividends (10,427) (10,427) (126,868)Other (1,750) (935) (11,378)Net cash provided by (used in) financing activities (26,225) 10,129 123,239Effect of exchange rate changes on cash and cash equivalents (4,207) (1,821) (22,158)Net increase (decrease) in cash and cash equivalents (14,124) 74,551 907,058Cash and cash equivalents at beginning of year 121,187 107,062 1,302,626Cash and cash equivalents at end of year (Note 1) ¥ 107,062 ¥ 181,614 $ 2,209,685The accompanying notes are an integral part of these statements.NIPPON EXPRESS <strong>Annual</strong> <strong>Report</strong> <strong>2012</strong>31


![Business Report for the 102nd Term [PDF 718KB] - Nippon Express](https://img.yumpu.com/46285896/1/184x260/business-report-for-the-102nd-term-pdf-718kb-nippon-express.jpg?quality=85)
![CSR Report 2010 [PDF 5764KB] - Nippon Express](https://img.yumpu.com/45662405/1/184x260/csr-report-2010-pdf-5764kb-nippon-express.jpg?quality=85)