Annual Report 2012
Annual Report 2012
Annual Report 2012

Create successful ePaper yourself
Turn your PDF publications into a flip-book with our unique Google optimized e-Paper software.
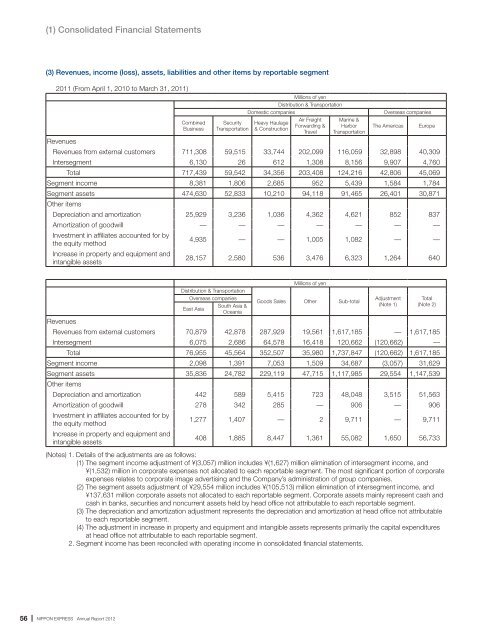
(1) Consolidated Financial Statements(3) Revenues, income (loss), assets, liabilities and other items by reportable segment2011 (From April 1, 2010 to March 31, 2011)CombinedBusinessSecurityTransportationMillions of yenDistribution & TransportationDomestic companiesHeavy Haulage& ConstructionAir FreightForwarding &TravelMarine &HarborTransportationOverseas companiesThe AmericasRevenuesRevenues from external customers 711,308 59,515 33,744 202,099 116,059 32,898 40,309Intersegment 6,130 26 612 1,308 8,156 9,907 4,760Total 717,439 59,542 34,356 203,408 124,216 42,806 45,069Segment income 8,381 1,806 2,685 952 5,439 1,584 1,784Segment assets 474,630 52,833 10,210 94,118 91,465 26,401 30,871Other itemsDepreciation and amortization 25,929 3,236 1,036 4,362 4,621 852 837Amortization of goodwill — — — — — — —Investment in affiliates accounted for bythe equity method4,935 — — 1,005 1,082 — —Increase in property and equipment andintangible assets28,157 2,580 536 3,476 6,323 1,264 640EuropeMillions of yenDistribution & TransportationOverseas companiesAdjustment TotalGoods Sales Other Sub-totalSouth Asia &(Note 1) (Note 2)East AsiaOceaniaRevenuesRevenues from external customers 70,879 42,878 287,929 19,561 1,617,185 — 1,617,185Intersegment 6,075 2,686 64,578 16,418 120,662 (120,662) —Total 76,955 45,564 352,507 35,980 1,737,847 (120,662) 1,617,185Segment income 2,098 1,391 7,053 1,509 34,687 (3,057) 31,629Segment assets 35,836 24,782 229,119 47,715 1,117,985 29,554 1,147,539Other itemsDepreciation and amortization 442 589 5,415 723 48,048 3,515 51,563Amortization of goodwill 278 342 285 — 906 — 906Investment in affiliates accounted for bythe equity method1,277 1,407 — 2 9,711 — 9,711Increase in property and equipment andintangible assets408 1,885 8,447 1,361 55,082 1,650 56,733(Notes) 1. Details of the adjustments are as follows:(1) The segment income adjustment of ¥(3,057) million includes ¥(1,627) million elimination of intersegment income, and¥(1,532) million in corporate expenses not allocated to each reportable segment. The most significant portion of corporateexpenses relates to corporate image advertising and the Company’s administration of group companies.(2) The segment assets adjustment of ¥29,554 million includes ¥(105,513) million elimination of intersegment income, and¥137,631 million corporate assets not allocated to each reportable segment. Corporate assets mainly represent cash andcash in banks, securities and noncurrent assets held by head office not attributable to each reportable segment.(3) The depreciation and amortization adjustment represents the depreciation and amortization at head office not attributableto each reportable segment.(4) The adjustment in increase in property and equipment and intangible assets represents primarily the capital expendituresat head office not attributable to each reportable segment.2. Segment income has been reconciled with operating income in consolidated financial statements.56 NIPPON EXPRESS <strong>Annual</strong> <strong>Report</strong> <strong>2012</strong>


![Business Report for the 102nd Term [PDF 718KB] - Nippon Express](https://img.yumpu.com/46285896/1/184x260/business-report-for-the-102nd-term-pdf-718kb-nippon-express.jpg?quality=85)
![CSR Report 2010 [PDF 5764KB] - Nippon Express](https://img.yumpu.com/45662405/1/184x260/csr-report-2010-pdf-5764kb-nippon-express.jpg?quality=85)