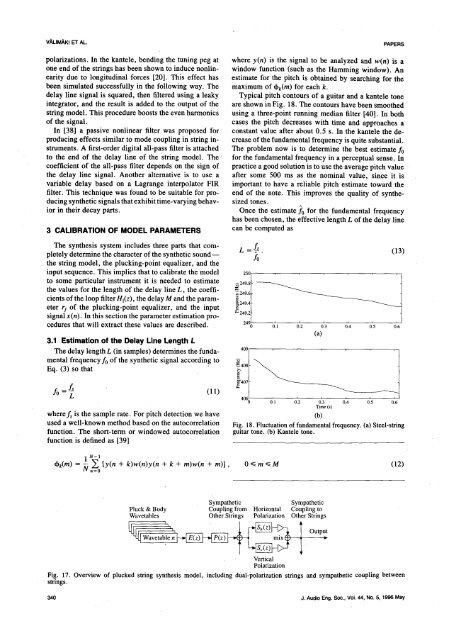
V]_LIM_.KI ETAL.PAPERSpolarizations. In the kantele, bending the tuning peg at where y(n) is the signal <strong>to</strong> be analyzed and w(n) is aone end <strong>of</strong> the strings has been shown <strong>to</strong> induce nonlin- window function (such as the Hamming window). Anearity due <strong>to</strong> longitudinal forces [20]. This effect has estimate for the pitch is obtained by searching for thebeen simulated successfully in the following way. The maximum <strong>of</strong> _bk(m)for each k.delay line signal is squared, then filtered using a leaky Typical pitch con<strong>to</strong>urs <strong>of</strong> a guitar and a kantele <strong>to</strong>neintegra<strong>to</strong>r, and the result is added <strong>to</strong> the output <strong>of</strong> the are shown in Fig. 18. The con<strong>to</strong>urs have been smoothedstring model. This procedure boosts the even harmonics using a three-point running median filter [40]. In both<strong>of</strong> the signal, cases the pitch decreases <strong>with</strong> time and approaches aIn [38] a passive nonlinear filter was PrOPosed for constant value after about 0.5 s. In the kantele the deproducingeffects similar <strong>to</strong> mode coupling in string in- crease <strong>of</strong> the fundamental frequency is quite substantial..struments. A first-order digital all-pass filter is attached The problem now is <strong>to</strong> determine the best estimate fo<strong>to</strong> the end <strong>of</strong> the delay line <strong>of</strong> the string model. The · for the fundamental frequency in a perceptual sense. Incoefficient <strong>of</strong> the all-pass filter depends on the sign <strong>of</strong> practice a good solution is <strong>to</strong> use the average pitch valuethe delay line signal. Another alternative is <strong>to</strong> use a after some 500 ms as the nominal value, since it isvariable delay based on a Lagrange interpola<strong>to</strong>r FIR important <strong>to</strong> have a reliable pitch estimate <strong>to</strong>ward thefilter. This technique was found <strong>to</strong> be suitable for pro- end <strong>of</strong> the note. This improves the quality <strong>of</strong> syntheducingsynthetic signals that exhibit time-varying behav- sized <strong>to</strong>nes.ior in their decay parts. Once the estimate .f0 for the fundamental frequencyhas been chosen, the effective length L <strong>of</strong> the delay line3 CALIBRATION OF MODEL PARAMETERS can be computed asThe synthesis system includes three parts that corn- fspletely determine the character <strong>of</strong> the synthetic sound-- L =for-. (13)the string model, the plucking-point equalizer, and theinput sequence. This implies that <strong>to</strong> calibrate the model 250[ , j<strong>to</strong> some particular instrument it is needed <strong>to</strong> estimatethe values for the length <strong>of</strong> the delay line L, the coeffi-_249.8I__cients <strong>of</strong> the loop filter Hi(z), the delay M and the param-_249'6I_249.4 Ieter signalrfx(n). <strong>of</strong> the In plucking-point this section the parameter equalizer, estimation and the input procedures_ 249'2Ithat will extract these values are described. 249_ o'.l o'.2 o13 0'.4 o15 0.6(a)3.1 Estimation <strong>of</strong> the Delay Line Length LThe delay length L (in samples) determines the funda- 409 1mental frequency fo <strong>of</strong> the synthetic signal according <strong>to</strong>Eq. (3) so that_4o8fo = (11) _--406 01.! 0'.2 0'.3 01.4 0.5 0.6Time(s)wherefs is the sample rate. For pitch detection we have (b)used a well-known method based on the au<strong>to</strong>correlation Fig. 18. Fluctuation <strong>of</strong> fundamental frequency. (a) Steel-stringfunction. The short-term or windowed au<strong>to</strong>correlation gmtar <strong>to</strong>ne. (b) Kantele <strong>to</strong>ne.functio n is defined as [39]1N-1_k(m) = _ _'=o[y(n + k)w(n)y(n + k + m)w(n + m)] , 0 _
PAPERSPHYSICALMODELINGOFPLUCKEDSTRINGINSTRUMENTSWhen the loop filter has also been designed, we can Spectral peak detection results in a sequence <strong>of</strong> magnisubtractits phase delay from L and define the nominal tude and frequency pairs for each harmonic. The sefractionaldelay Lr as quence <strong>of</strong> magnitude values for one harmonic is calledthe envelope curve <strong>of</strong> that harmonic. A straight line isLr = L - 'tH(C00)- floor[L - %/(COo)] (14) matched <strong>to</strong> each envelope curve on a decibel scale, sinceideally the magnitude <strong>of</strong> every harmonic should decaywhere cb0 = 2_rjeo. The delay Lr is used as the desired exponentially, that is, linearly on a logarithmic scale.delay in the design <strong>of</strong> the fractional delay filter F(z). In Measurements show that this idealized case is rarely metpractice the phase delay <strong>of</strong> this filter can be expressed in practice, and many different kinds <strong>of</strong> deviations areas xF(Co) = Mr + Lr, where positive integer Mr is the common. It is possible <strong>to</strong> decrease the error in fit byintegral part <strong>of</strong> the phase delay that depends on the order starting it at the maximum <strong>of</strong> the envelope curve [43]<strong>of</strong> the fractional delay filter and Lr is the fractional part. and by terminating it before the data get mixed <strong>with</strong> thenoise floor, such as after the decay <strong>of</strong> about 40 dB. As3.2 Measuring the Frequency-Dependent a result, a collection <strong>of</strong> slopes I_k for k = 1, 2.....Damping N h is obtained (see Fig. 19). The corresponding loopNext we discuss how <strong>to</strong> measure damping <strong>of</strong> a string gain <strong>of</strong> the string model at the harmonic frequencies isas a function <strong>of</strong> frequency. As discussed in Section 2.1, computed asall losses, including the reflection at the two ends <strong>of</strong> thestring, are incorporated in the loop filter Hi(z). In order Gk = 10_Aa°H , k = 1,2 ..... N h (17)<strong>to</strong> design a loop filter we need <strong>to</strong> estimate the dampingfac<strong>to</strong>rs at the harmonic frequencies <strong>of</strong> the sound signal, where [3k are the slopes <strong>of</strong> the envelopes and H is theThis is achieved using the short-time Fourier transform hop size. The sequence Gk determines the pro<strong>to</strong>type(STFT) [19] and tracking the amplitude <strong>of</strong> each har- magnitude response <strong>of</strong> the loop filter Hl(o_) at the harmonic,monic frequencies o_k, k = 1, 2 ..... N h, as illustratedThe STFT <strong>of</strong> y(n) is a sequence <strong>of</strong>'discrete Fourier in Fig. 20.transforms (DFT) defined as The desired phase response for Hl(_) can be determinedbased on the frequency estimates <strong>of</strong> the harmon-N- _ ics. We do not, however, try <strong>to</strong> match the phase responseYm(k)= n=O _ w(n)y(n + mH)e -j'°_ , m = 0, 1, 2,... <strong>of</strong> the filter. There are two principal reasons for this.(15) First we believe that it is much more important <strong>to</strong> matchthe time constants <strong>of</strong> the partials <strong>of</strong> the synthetic sound<strong>with</strong> than the frequencies <strong>of</strong> the partials, since rather smalldeviations from harmonic frequencies occur in the case2_rk <strong>of</strong> plucked string instruments. In case we wanted <strong>to</strong>,r_°k - N ' k = 0, 1, 2 ..... N - 1 ' (16) resynthesize strongly inharmonic <strong>to</strong>nes, the phase response<strong>of</strong> the loop filter should be considered. The secwhereN is the length <strong>of</strong> the DFT, w(n) is a window ond reason is that as we want <strong>to</strong> use a low-order loopfunction, and H is the hop size or time advance (in filter, the complex approximation <strong>of</strong> the frequency re-'samples) per frame. In practice we compute each DFT sponse would not be very successful. Thus we restrictusing the FFT algorithm. To obtain a suitable compro- ourselves <strong>to</strong> magnitude approximation only in the loopmise between time and frequency resolution, we use a filter design.window length <strong>of</strong> four times the period length <strong>of</strong> thesignal. The overlap <strong>of</strong> the windows is 50%, implyingthat H is 0.5 times the window length. We apply exces- . . ' .....sive zero padding by filling the signal buffer <strong>with</strong> zeros __ _ ' 2 '<strong>to</strong> reach N = 4096 in order <strong>to</strong> increase the resolutioning <strong>to</strong> harmonics can be found from the magnitude spectrumfirst finding the nearest local minimum at both -_cbetween sides <strong>of</strong> an these assumed two local maximum. minima The is assumed largest magnitude <strong>to</strong> be the _-_5 ._ _---_____ __inthefrequencydomain.by harmonic peak. The estimates Thespectralpeakscorrespond- for the frequency and :_ _ _._.. 3magnitude <strong>of</strong> the peak are fine-tuned by applying para- -2cbolic interpolation around the local maximum and solvingfor the value and location <strong>of</strong> the maximum <strong>of</strong> this -2_interpolating function (see [41] or [42] for details). Thenumber <strong>of</strong> harmonics <strong>to</strong> be detected is typically Nh < -3c 0.05 01! 0.15 012 0.25 0'.3 0.35 0'.4 0.45 0.520 (for the acoustic guitar). The STFT analysis is applied Time(s)<strong>to</strong> the portion <strong>of</strong> the signal that starts before the attack Fig. 19. Straight-line fits (dotted lines) <strong>of</strong> envelope curvesand ends after some 0.5-1 s after the attack. (solid lines) <strong>of</strong> six lowest harmonics <strong>of</strong> electric guitar <strong>to</strong>ne.J.AudioEng.Soc.,Vol.44,No.5, 1996May 341