Hydrologic Issues for Dams - Association of State Dam Safety Officials
Hydrologic Issues for Dams - Association of State Dam Safety Officials
Hydrologic Issues for Dams - Association of State Dam Safety Officials

Create successful ePaper yourself
Turn your PDF publications into a flip-book with our unique Google optimized e-Paper software.
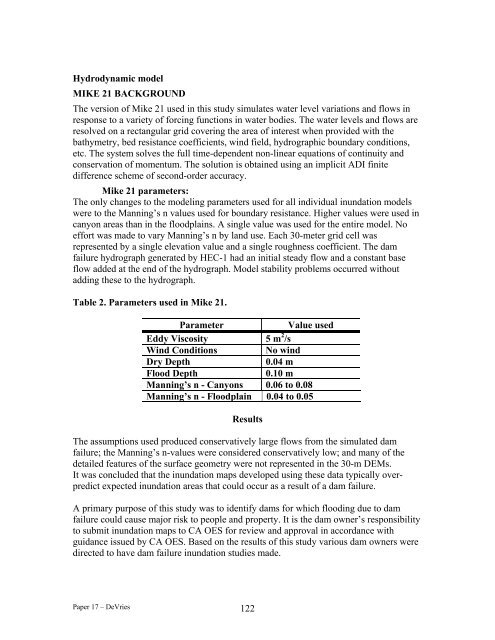
Hydrodynamic modelMIKE 21 BACKGROUNDThe version <strong>of</strong> Mike 21 used in this study simulates water level variations and flows inresponse to a variety <strong>of</strong> <strong>for</strong>cing functions in water bodies. The water levels and flows areresolved on a rectangular grid covering the area <strong>of</strong> interest when provided with thebathymetry, bed resistance coefficients, wind field, hydrographic boundary conditions,etc. The system solves the full time-dependent non-linear equations <strong>of</strong> continuity andconservation <strong>of</strong> momentum. The solution is obtained using an implicit ADI finitedifference scheme <strong>of</strong> second-order accuracy.Mike 21 parameters:The only changes to the modeling parameters used <strong>for</strong> all individual inundation modelswere to the Manning’s n values used <strong>for</strong> boundary resistance. Higher values were used incanyon areas than in the floodplains. A single value was used <strong>for</strong> the entire model. Noef<strong>for</strong>t was made to vary Manning’s n by land use. Each 30-meter grid cell wasrepresented by a single ele vation value and a single roughness coefficient. The damfailure hydrograph generated by HEC-1 had an initial steady flow and a constant baseflow added at the end <strong>of</strong> the hydrograph. Model stability problems occurred withoutadding these to the hydrograph.Table 2. Parameters used in Mike 21.ParameterValue usedEddy Viscosity 5 m 2 /sWind ConditionsNo windDry Depth0.04 mFlood Depth0.10 mManning’s n - C anyons 0.06 to 0.08Manning’s n - Floodplain 0. 04 to 0.05ResultsThe assumptions used produced con servatively large flows from the simulated damfailure; the Manning’s n-values were considered conservativelylow; and many <strong>of</strong> thedetailed features <strong>of</strong> the surface geom etry were not represented in the 30-m DEMs.It was concluded that the inundation maps developed using these data typically over-expected inundation areas that could occur as a result <strong>of</strong> a dam predict failure.A primary purpose <strong>of</strong> this study was to identify dams <strong>for</strong> which flooding due to damfailure could cause major risk to people and property. It is the dam owner’s responsibilityto submit inundation maps to CA OES <strong>for</strong> review and approval in accordance withguidance issued by CA OES. Based on the results <strong>of</strong> this study various dam owners weredirected to have dam failure inundation studies made.Paper 17 – DeVries 122