Hydrologic Issues for Dams - Association of State Dam Safety Officials
Hydrologic Issues for Dams - Association of State Dam Safety Officials
Hydrologic Issues for Dams - Association of State Dam Safety Officials

Create successful ePaper yourself
Turn your PDF publications into a flip-book with our unique Google optimized e-Paper software.
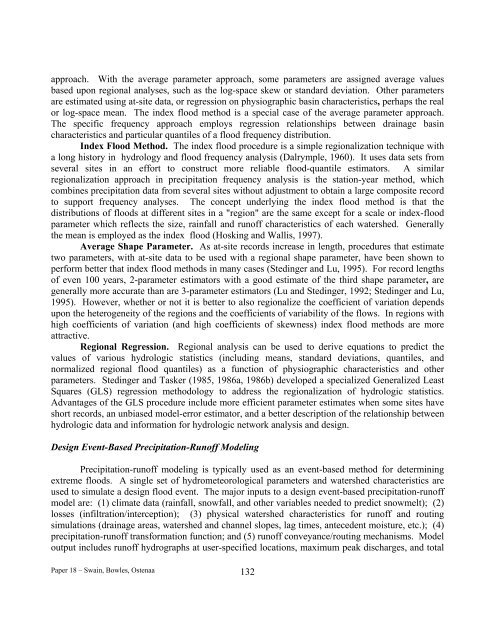
approach. With the average parameter approach, some parameters are assigned average valuesbased upon regional analyses, such as the log-space skew or standard deviation. Other parametersare estimated using at-site data, or regression on physiographic basin characteristics, perhaps the realor log-space mean. The index flood method is a special case <strong>of</strong> the average parameter approach.The specific frequency approach employs regression relationships between drainage basincharacteristics and particular quantiles <strong>of</strong> a flood frequency distribution.Index Flood Method. The index flood procedure is a simple regionalization technique witha long history in hydrology and flood frequency analysis (Dalrymple, 1960). It uses data sets fromseveral sites in an ef<strong>for</strong>t to construct more reliable flood-quantile estimators. A similarregionalization approach in precipitation frequency analysis is the station-year method, whichcombines precipitation data from several sites without adjustment to obtain a large composite recordto support frequency analyses. The concept underlying the index flood method is that thedistributions <strong>of</strong> floods at different sites in a "region" are the same except <strong>for</strong> a scale or index-floodparameter which reflects the size, rainfall and run<strong>of</strong>f characteristics <strong>of</strong> each watershed. Generallythe mean is employed as the index flood (Hosking and Wallis, 1997).Average Shape Parameter. As at-site records increase in length, procedures that estimatetwo parameters, with at-site data to be used with a regional shape parameter, have been shown toper<strong>for</strong>m better that index flood methods in many cases (Stedinger and Lu, 1995). For record lengths<strong>of</strong> even 100 years, 2-parameter estimators with a good estimate <strong>of</strong> the third shape parameter, aregenerally more accurate than are 3-parameter estimators (Lu and Stedinger, 1992; Stedinger and Lu,1995). However, whether or not it is better to also regionalize the coefficient <strong>of</strong> variation dependsupon the heterogeneity <strong>of</strong> the regions and the coefficients <strong>of</strong> variability <strong>of</strong> the flows. In regions withhigh coefficients <strong>of</strong> variation (and high coefficients <strong>of</strong> skewness) index flood methods are moreattractive.Regional Regression. Regional analysis can be use d to derive equation s to predict thevalues <strong>of</strong> various hydrologic statistics (including means, standard deviation s, quantiles, andnormalized regional flood quantiles) as a function <strong>of</strong> physiographic characteristics and otherparameters. Stedinger and Tasker (1985, 1986a, 1986b) developed a specialized Generalized LeastSquares (GLS) regression methodology to address the region alization <strong>of</strong> hydrologic statistics.Advantages <strong>of</strong> the GLS procedure include more efficient parame ter estimates when some sites haves hort records, an unbiased model-error estimator, and a better description <strong>of</strong> the relationship betweenhydrologic data and in<strong>for</strong>mation <strong>for</strong> hydrologic network analysis and design.Design Event-Based Precipitation-Run<strong>of</strong>f ModelingPrecipitation-run<strong>of</strong>f modeling is typically used as an event-based method <strong>for</strong> determiningextreme floods. A single set <strong>of</strong> hydrometeorological parameters and watershed characteristics areused to simulate a design flood event. The major inputs to a design event-based precipitation-run<strong>of</strong>fmodel are: (1) climate data (rainfall, snowfall, and other variables needed to predict snowmelt); (2)losses (infiltration/interception); (3) physical watershed characteristics <strong>for</strong> run<strong>of</strong>f and routingsimulations (drainage areas, watershed and channel slopes, lag times, antecedent moisture, etc.); (4)precipitation-run<strong>of</strong>f trans<strong>for</strong>mation function; and (5) run<strong>of</strong>f conveyance/routing mechanisms. Modeloutput includes run<strong>of</strong>f hydrographs at user-specified locations, maximum peak discharges, and totalPaper 18 – Swain, Bowles, Ostenaa 132