

Evaluation of the Two Year Key Stage 3 Project - Communities and ...
Evaluation of the Two Year Key Stage 3 Project - Communities and ...
Evaluation of the Two Year Key Stage 3 Project - Communities and ...

You also want an ePaper? Increase the reach of your titles
YUMPU automatically turns print PDFs into web optimized ePapers that Google loves.
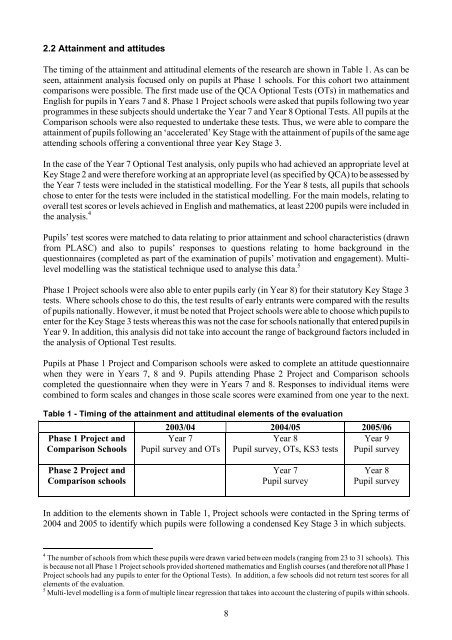
2.2 Attainment <strong>and</strong> attitudesThe timing <strong>of</strong> <strong>the</strong> attainment <strong>and</strong> attitudinal elements <strong>of</strong> <strong>the</strong> research are shown in Table 1. As can beseen, attainment analysis focused only on pupils at Phase 1 schools. For this cohort two attainmentcomparisons were possible. The first made use <strong>of</strong> <strong>the</strong> QCA Optional Tests (OTs) in ma<strong>the</strong>matics <strong>and</strong>English for pupils in <strong>Year</strong>s 7 <strong>and</strong> 8. Phase 1 <strong>Project</strong> schools were asked that pupils following two yearprogrammes in <strong>the</strong>se subjects should undertake <strong>the</strong> <strong>Year</strong> 7 <strong>and</strong> <strong>Year</strong> 8 Optional Tests. All pupils at <strong>the</strong>Comparison schools were also requested to undertake <strong>the</strong>se tests. Thus, we were able to compare <strong>the</strong>attainment <strong>of</strong> pupils following an ‘accelerated’ <strong>Key</strong> <strong>Stage</strong> with <strong>the</strong> attainment <strong>of</strong> pupils <strong>of</strong> <strong>the</strong> same ageattending schools <strong>of</strong>fering a conventional three year <strong>Key</strong> <strong>Stage</strong> 3.In <strong>the</strong> case <strong>of</strong> <strong>the</strong> <strong>Year</strong> 7 Optional Test analysis, only pupils who had achieved an appropriate level at<strong>Key</strong> <strong>Stage</strong> 2 <strong>and</strong> were <strong>the</strong>refore working at an appropriate level (as specified by QCA) to be assessed by<strong>the</strong> <strong>Year</strong> 7 tests were included in <strong>the</strong> statistical modelling. For <strong>the</strong> <strong>Year</strong> 8 tests, all pupils that schoolschose to enter for <strong>the</strong> tests were included in <strong>the</strong> statistical modelling. For <strong>the</strong> main models, relating tooverall test scores or levels achieved in English <strong>and</strong> ma<strong>the</strong>matics, at least 2200 pupils were included in<strong>the</strong> analysis. 4Pupils’ test scores were matched to data relating to prior attainment <strong>and</strong> school characteristics (drawnfrom PLASC) <strong>and</strong> also to pupils’ responses to questions relating to home background in <strong>the</strong>questionnaires (completed as part <strong>of</strong> <strong>the</strong> examination <strong>of</strong> pupils’ motivation <strong>and</strong> engagement). Multilevelmodelling was <strong>the</strong> statistical technique used to analyse this data. 5Phase 1 <strong>Project</strong> schools were also able to enter pupils early (in <strong>Year</strong> 8) for <strong>the</strong>ir statutory <strong>Key</strong> <strong>Stage</strong> 3tests. Where schools chose to do this, <strong>the</strong> test results <strong>of</strong> early entrants were compared with <strong>the</strong> results<strong>of</strong> pupils nationally. However, it must be noted that <strong>Project</strong> schools were able to choose which pupils toenter for <strong>the</strong> <strong>Key</strong> <strong>Stage</strong> 3 tests whereas this was not <strong>the</strong> case for schools nationally that entered pupils in<strong>Year</strong> 9. In addition, this analysis did not take into account <strong>the</strong> range <strong>of</strong> background factors included in<strong>the</strong> analysis <strong>of</strong> Optional Test results.Pupils at Phase 1 <strong>Project</strong> <strong>and</strong> Comparison schools were asked to complete an attitude questionnairewhen <strong>the</strong>y were in <strong>Year</strong>s 7, 8 <strong>and</strong> 9. Pupils attending Phase 2 <strong>Project</strong> <strong>and</strong> Comparison schoolscompleted <strong>the</strong> questionnaire when <strong>the</strong>y were in <strong>Year</strong>s 7 <strong>and</strong> 8. Responses to individual items werecombined to form scales <strong>and</strong> changes in those scale scores were examined from one year to <strong>the</strong> next.Table 1 - Timing <strong>of</strong> <strong>the</strong> attainment <strong>and</strong> attitudinal elements <strong>of</strong> <strong>the</strong> evaluationPhase 1 <strong>Project</strong> <strong>and</strong>Comparison Schools2003/04 2004/05 2005/06<strong>Year</strong> 7<strong>Year</strong> 8<strong>Year</strong> 9Pupil survey <strong>and</strong> OTs Pupil survey, OTs, KS3 tests Pupil surveyPhase 2 <strong>Project</strong> <strong>and</strong>Comparison schools<strong>Year</strong> 7Pupil survey<strong>Year</strong> 8Pupil surveyIn addition to <strong>the</strong> elements shown in Table 1, <strong>Project</strong> schools were contacted in <strong>the</strong> Spring terms <strong>of</strong>2004 <strong>and</strong> 2005 to identify which pupils were following a condensed <strong>Key</strong> <strong>Stage</strong> 3 in which subjects.4 The number <strong>of</strong> schools from which <strong>the</strong>se pupils were drawn varied between models (ranging from 23 to 31 schools). Thisis because not all Phase 1 <strong>Project</strong> schools provided shortened ma<strong>the</strong>matics <strong>and</strong> English courses (<strong>and</strong> <strong>the</strong>refore not all Phase 1<strong>Project</strong> schools had any pupils to enter for <strong>the</strong> Optional Tests). In addition, a few schools did not return test scores for allelements <strong>of</strong> <strong>the</strong> evaluation.5 Multi-level modelling is a form <strong>of</strong> multiple linear regression that takes into account <strong>the</strong> clustering <strong>of</strong> pupils within schools.8


