

Evaluation of the Two Year Key Stage 3 Project - Communities and ...
Evaluation of the Two Year Key Stage 3 Project - Communities and ...
Evaluation of the Two Year Key Stage 3 Project - Communities and ...

Create successful ePaper yourself
Turn your PDF publications into a flip-book with our unique Google optimized e-Paper software.
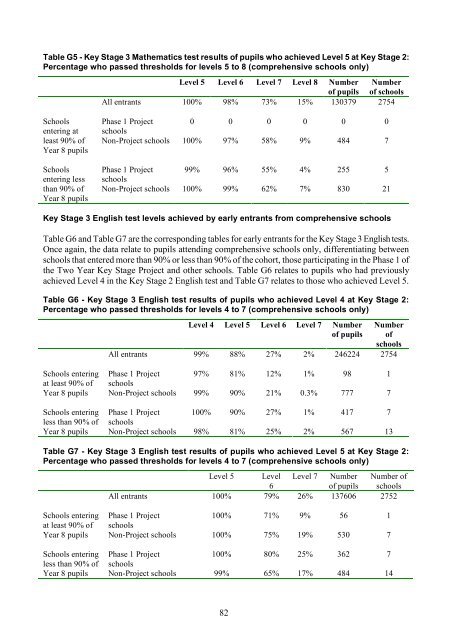
Table G5 - <strong>Key</strong> <strong>Stage</strong> 3 Ma<strong>the</strong>matics test results <strong>of</strong> pupils who achieved Level 5 at <strong>Key</strong> <strong>Stage</strong> 2:Percentage who passed thresholds for levels 5 to 8 (comprehensive schools only)Level 5 Level 6 Level 7 Level 8 Number Number<strong>of</strong> pupils <strong>of</strong> schoolsAll entrants 100% 98% 73% 15% 130379 2754Schoolsentering atleast 90% <strong>of</strong><strong>Year</strong> 8 pupilsSchoolsentering lessthan 90% <strong>of</strong><strong>Year</strong> 8 pupilsPhase 1 <strong>Project</strong>schools0 0 0 0 0 0Non-<strong>Project</strong> schools 100% 97% 58% 9% 484 7Phase 1 <strong>Project</strong> 99% 96% 55% 4% 255 5schoolsNon-<strong>Project</strong> schools 100% 99% 62% 7% 830 21<strong>Key</strong> <strong>Stage</strong> 3 English test levels achieved by early entrants from comprehensive schoolsTable G6 <strong>and</strong> Table G7 are <strong>the</strong> corresponding tables for early entrants for <strong>the</strong> <strong>Key</strong> <strong>Stage</strong> 3 English tests.Once again, <strong>the</strong> data relate to pupils attending comprehensive schools only, differentiating betweenschools that entered more than 90% or less than 90% <strong>of</strong> <strong>the</strong> cohort, those participating in <strong>the</strong> Phase 1 <strong>of</strong><strong>the</strong> <strong>Two</strong> <strong>Year</strong> <strong>Key</strong> <strong>Stage</strong> <strong>Project</strong> <strong>and</strong> o<strong>the</strong>r schools. Table G6 relates to pupils who had previouslyachieved Level 4 in <strong>the</strong> <strong>Key</strong> <strong>Stage</strong> 2 English test <strong>and</strong> Table G7 relates to those who achieved Level 5.Table G6 - <strong>Key</strong> <strong>Stage</strong> 3 English test results <strong>of</strong> pupils who achieved Level 4 at <strong>Key</strong> <strong>Stage</strong> 2:Percentage who passed thresholds for levels 4 to 7 (comprehensive schools only)Level 4 Level 5 Level 6 Level 7 Number<strong>of</strong> pupilsNumber<strong>of</strong>schoolsAll entrants 99% 88% 27% 2% 246224 2754Schools entering Phase 1 <strong>Project</strong> 97% 81% 12% 1% 98 1at least 90% <strong>of</strong> schools<strong>Year</strong> 8 pupils Non-<strong>Project</strong> schools 99% 90% 21% 0.3% 777 7Schools entering Phase 1 <strong>Project</strong> 100% 90% 27% 1% 417 7less than 90% <strong>of</strong> schools<strong>Year</strong> 8 pupils Non-<strong>Project</strong> schools 98% 81% 25% 2% 567 13Table G7 - <strong>Key</strong> <strong>Stage</strong> 3 English test results <strong>of</strong> pupils who achieved Level 5 at <strong>Key</strong> <strong>Stage</strong> 2:Percentage who passed thresholds for levels 4 to 7 (comprehensive schools only)Level 5 Level Level 7 Number Number <strong>of</strong>6<strong>of</strong> pupils schoolsAll entrants 100% 79% 26% 137606 2752Schools entering Phase 1 <strong>Project</strong>100% 71% 9% 56 1at least 90% <strong>of</strong> schools<strong>Year</strong> 8 pupils Non-<strong>Project</strong> schools 100% 75% 19% 530 7Schools entering Phase 1 <strong>Project</strong>100% 80% 25% 362 7less than 90% <strong>of</strong> schools<strong>Year</strong> 8 pupils Non-<strong>Project</strong> schools 99% 65% 17% 484 1482


