

Taxonomy and Ecology Of Inland Sand Dune ... - Mycorrhizae
Taxonomy and Ecology Of Inland Sand Dune ... - Mycorrhizae
Taxonomy and Ecology Of Inland Sand Dune ... - Mycorrhizae

You also want an ePaper? Increase the reach of your titles
YUMPU automatically turns print PDFs into web optimized ePapers that Google loves.
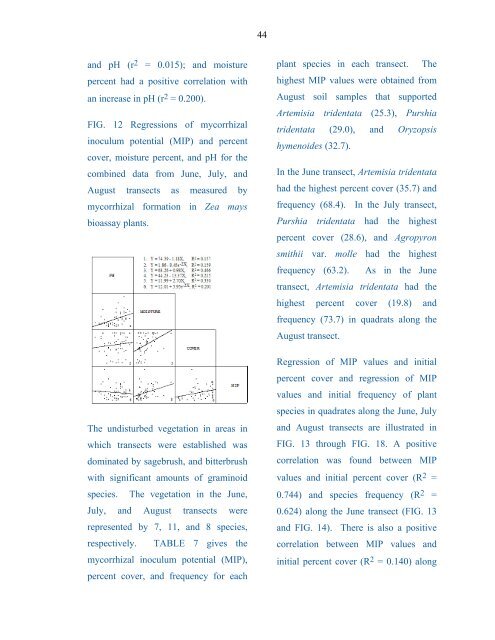
44<strong>and</strong> pH (r 2 = 0.015); <strong>and</strong> moisturepercent had a positive correlation withan increase in pH (r 2 = 0.200).FIG. 12 Regressions of mycorrhizalinoculum potential (MIP) <strong>and</strong> percentcover, moisture percent, <strong>and</strong> pH for thecombined data from June, July, <strong>and</strong>August transects as measured bymycorrhizal formation in Zea maysbioassay plants.The undisturbed vegetation in areas inwhich transects were established wasdominated by sagebrush, <strong>and</strong> bitterbrushwith significant amounts of graminoidspecies. The vegetation in the June,July, <strong>and</strong> August transects wererepresented by 7, 11, <strong>and</strong> 8 species,respectively. TABLE 7 gives themycorrhizal inoculum potential (MIP),percent cover, <strong>and</strong> frequency for eachplant species in each transect. Thehighest MIP values were obtained fromAugust soil samples that supportedArtemisia tridentata (25.3), Purshiatridentata (29.0), <strong>and</strong> Oryzopsishymenoides (32.7).In the June transect, Artemisia tridentatahad the highest percent cover (35.7) <strong>and</strong>frequency (68.4). In the July transect,Purshia tridentata had the highestpercent cover (28.6), <strong>and</strong> Agropyronsmithii var. molle had the highestfrequency (63.2). As in the Junetransect, Artemisia tridentata had thehighest percent cover (19.8) <strong>and</strong>frequency (73.7) in quadrats along theAugust transect.Regression of MIP values <strong>and</strong> initialpercent cover <strong>and</strong> regression of MIPvalues <strong>and</strong> initial frequency of plantspecies in quadrates along the June, July<strong>and</strong> August transects are illustrated inFIG. 13 through FIG. 18. A positivecorrelation was found between MIPvalues <strong>and</strong> initial percent cover (R 2 =0.744) <strong>and</strong> species frequency (R 2 =0.624) along the June transect (FIG. 13<strong>and</strong> FIG. 14). There is also a positivecorrelation between MIP values <strong>and</strong>initial percent cover (R 2 = 0.140) along