Meningococcal disease in the Netherl<strong>an</strong>ds, 1958-1990The p<strong>an</strong>el of monoclonal <strong>an</strong>tibodies, which were produced as previously described,15is shown in Table 1. Monoclonal <strong>an</strong>tibodies specific for subtypes Pl.4, P1.lO, Pl.12<strong>an</strong>d Pl.14 have been developed recently <strong>an</strong>d have not been described before. These<strong>an</strong>tibodies were defined to be specific for class 1 OMPs by me<strong>an</strong>s of immunoblotting<strong>an</strong>alysis.To <strong>an</strong>alyse whether the serotypes <strong>an</strong>d subtypes th<strong>at</strong> appeared in the 1980s amongserogroup B meningococci were newly-introduced in the Netherl<strong>an</strong>ds, we serotyped<strong>an</strong>d subtyped all serogroup B isol<strong>at</strong>es obtained in 1960, 1965, 1970, <strong>an</strong>d 1975.Because m<strong>an</strong>y isol<strong>at</strong>es from 1960 <strong>an</strong>d 1965 had been lost in storage, typing wasextended to serogroup B isol<strong>at</strong>es obtained in adjacent years. The influence of longtermstorage of isol<strong>at</strong>es <strong>at</strong> -70°C on OMP typing was tested by comparison of thecurrent typing results with those of isol<strong>at</strong>es obtained between 1958 <strong>an</strong>d 1981, whichhad already been screened for the presence of serotype 2a <strong>an</strong>d 2b by filter radioimmunoassay<strong>an</strong>d for serotype 15 by staphylococcal coagglutin<strong>at</strong>ioll. I 6-18 Differenceswith former typing results were minor (6%), thereby indic<strong>at</strong>ing th<strong>at</strong> long-term storage<strong>at</strong> -70°C probably has no major effect on OMP-typing.To assess the associ<strong>at</strong>ion between genotypes <strong>an</strong>d serosubtypes, as determined withthe current extensive set of monoclonal <strong>an</strong>tibodies, we serotyped <strong>an</strong>d sub typed allserogroup B isol<strong>at</strong>es obtained between 1958 <strong>an</strong>d 1986, of which the electrophoretictype (ET) was determined by Caug<strong>an</strong>t et al. I3St<strong>at</strong>istical methodsSt<strong>at</strong>istics pertaining to the Dutch popul<strong>at</strong>ion were obtained from the CentralBureau of St<strong>at</strong>istics.The X' test was used for the <strong>an</strong>alysis of contingency tables. In these <strong>an</strong>alyses theserogroups X, Y, Z, W-135, <strong>an</strong>d 29E <strong>an</strong>d nongroupable isol<strong>at</strong>es were combinedbecause of their small numbers. For the same reaSOD, the serotypes 1, 14, <strong>an</strong>d 16 <strong>an</strong>dthe subtypes Pl.l, Pl.6, Pl.7, P1.7,1, Pl.9, Pl.lO, Pl.l2, <strong>an</strong>d Pl.l4 among serogroupB meningococci <strong>an</strong>d the serotypes 1, 14, 15, <strong>an</strong>d 16 <strong>an</strong>d the subtypes P1.1, Pl.4, Pl.7,Pl.7,1, Pl.7,16, P1.9, Pl.lO, Pl.l2, Pl.15, <strong>an</strong>d Pl.l6 among serogroup C meningococciwere combined. M<strong>an</strong>tels test was used to test for trends of proportions. 19RESULTSThe general results will be presented for the period 1980-1990. In regard to isol<strong>at</strong>esof serogroup B, the findings of the period 1958-1990 are described.Incidence <strong>an</strong>d serogroup distributionFrom 1980 to 1990, isol<strong>at</strong>es of N. meningitidis from 3354 p<strong>at</strong>ients (1740 males,1548 females, 66 of unspecified gender; male/female r<strong>at</strong>io, 1.12) were submitted tothe RLBM.21
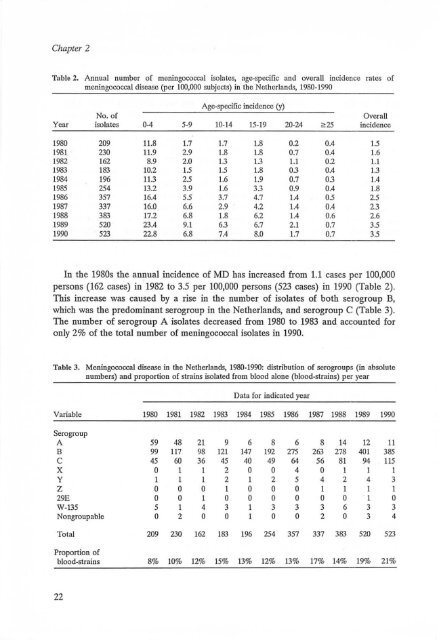
Chapter 2Table 2. <strong>An</strong> nual number of meningococcal isol<strong>at</strong>es, agc.spccific <strong>an</strong>d QvcraU incidence r<strong>at</strong>cs ofmeningococcal disease (per 100,000 subjects) in the Netherl<strong>an</strong>ds, 1980· 1990Age-specific incidence (y)No. ofOverallYear isol<strong>at</strong>es 0-4 5-9 10-14 15-19 20-24 ",25 incidence1980 209 11.8 1.7 1.7 1.8 0.2 0.4 1.51981 230 11.9 2.9 1.8 1.8 0.7 0.4 1.61982 162 8.9 2.0 1.3 1.3 1.1 0.2 1.11983 183 10.2 1.5 1.5 1.8 0.3 0.4 1.31984 196 11.3 2.5 1.6 1.9 0.7 0.3 1.41985 254 13.2 3.9 1.6 3.3 0.9 0.4 1.81986 357 16.4 5.5 3.7 4.7 1.4 0.5 2.51987 337 16.0 6.6 2.9 4.2 1.4 0.4 2.31988 383 17.2 6.8 1.8 6.2 1.4 0.6 2.61989 520 23.4 9.1 6.3 6.7 2.1 0.7 3.51990 523 22.8 6.8 7.4 8.0 1.7 0.7 3.5In the 1980s the <strong>an</strong>nual incidence of MD has increased from 1.1 cases per 100,000persons (162 cases) in 1982 to 3.5 per 100,000 persons (523 cases) in 1990 (Table 2).11tis increase was caused by a rise in the number of isol<strong>at</strong>es of both serogroup B,which was the predomin<strong>an</strong>t serogroup in the Netherl<strong>an</strong>ds, <strong>an</strong>d serogroup C (Table 3)_The number of serogroup A isol<strong>at</strong>es decreased from 1980 to 1983 <strong>an</strong>d accounted foro<strong>nl</strong>y 2% of the total number of meningococcal isol<strong>at</strong>es in 1990.Table 3. Meningococcal disease in the Netherl<strong>an</strong>ds, 1980· 1990: distribution o f serogroups (in absolutenumbers) <strong>an</strong>d proportion of strains isol<strong>at</strong>ed from blood alone (blood-strains) per yearD<strong>at</strong>a for indic<strong>at</strong>ed yearVari able 1980 1981 1982 1983 1984 1985 1986 1987 1988 1989 1990SerogroupA 59 48 21 9 6 8 6 8 14 12 11B 99 117 98 121 147 192 275 263 278 401 385C 45 60 36 45 40 49 64 56 81 94 115X 0 1 I 2 0 0 4 0 1 1 1Y 1 I I 2 I 2 5 4 2 4 3Z 0 0 0 1 0 0 0 1 1 1 129E 0 0 I 0 0 0 0 0 0 1 0W-135 5 1 4 3 1 3 3 3 6 3 3Nongroupable 0 2 0 0 1 0 0 2 0 3 4Total 209 230 162 183 196 254 357 337 383 520 523Proportion ofblood-strains 8% 10% 12% 15% 13% 12% 13% 17% 14% 19% 21%22