An attempt at an epidemiological explanation - Epib.nl
An attempt at an epidemiological explanation - Epib.nl
An attempt at an epidemiological explanation - Epib.nl
- No tags were found...

Create successful ePaper yourself
Turn your PDF publications into a flip-book with our unique Google optimized e-Paper software.
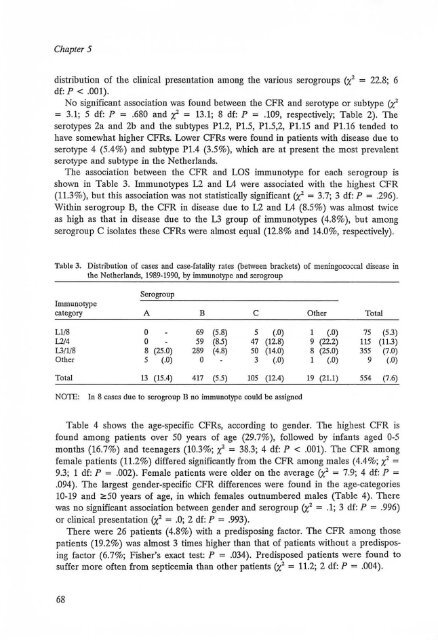
Chapter 5distribution of the clinical present<strong>at</strong>ion among the various serogroups (X' = 22.8; 6df: P < .001).No signific<strong>an</strong>t associ<strong>at</strong>ion was found between the CFR <strong>an</strong>d serotype or sub type (X'= 3.1; 5 df: P = .680 <strong>an</strong>d X' = 13.1; 8 df: P = .109, respectively; Table 2). Theserotypes 2a <strong>an</strong>d 2b <strong>an</strong>d the subtypes P1.2, P1.5, P1.5,2, P1.15 <strong>an</strong>d P1.16 tended tohave somewh<strong>at</strong> higher CFRs. Lower CFRs were found in p<strong>at</strong>ients with disease due toserotype 4 (5.4%) <strong>an</strong>d subtype P1.4 (3.5%), which are <strong>at</strong> present the most prevalentserotype <strong>an</strong>d subtype in the Netherl<strong>an</strong>ds.The associ<strong>at</strong>ion between the CFR <strong>an</strong>d LOS immunotype for each serogroup isshown in Table 3. Immunotypes L2 <strong>an</strong>d L4 were associ<strong>at</strong>ed with the highest CFR(11 .3%), but this associ<strong>at</strong>ion was not st<strong>at</strong>istically signific<strong>an</strong>t (X' = 3.7; 3 df: P = .296).Within serogroup E, the CFR in disease due to L2 <strong>an</strong>d L4 (8.5%) was almost twiceas high as th<strong>at</strong> in disease due to the L3 group of immunotypes (4.8%), but amongserogroup C isol<strong>at</strong>es these CFRs were almost equal (12.8% <strong>an</strong>d 14.0%, respectively).Table 3. Distribution of cases <strong>an</strong>d case-f<strong>at</strong>ality r<strong>at</strong>es (between brackets) of meningococcal disease inthe Netherl<strong>an</strong>ds, 1989-1990, by immUDotypC <strong>an</strong>d serogroupSerogroupImmuDotypcc<strong>at</strong>egory A B C Other TotalLl/8 0 69 (5.8) 5 (.0) 1 (.0) 75 (5.3)1214 0 59 (8.5) 47 (12.8) 9 (22.2) 115 (11.3)L3/1/8 8 (25 .0) 289 (4.8) 50 (14.0) 8 (25 .0) 355 (7.0)Other 5 (.0) 0 3 (.0) 1 (.0) 9 (.0)Total 13 (15.4) 417 (5.5) 105 (12.4) 19 (21.1) 554 (7.6)NOTE:In 8 cases due to serogrollp B no immunolype could be assignedTable 4 shows the age-specific CFRs, according to gender. The highest CFR isfound among p<strong>at</strong>ients over 50 years of age (29.7%), followed by inf<strong>an</strong>ts aged 0-5months (16.7%) <strong>an</strong>d teenagers (10.3%; X' = 38.3; 4 df: P < .001). The CFR amongfemale p<strong>at</strong>ients (11.2%) differed signific<strong>an</strong>tly from the CFR among males (4.4%; X' =9.3; 1 df: P = .002). Female p<strong>at</strong>ients were older on the average (X' = 7.9; 4 df: P =.094). The largest gender-specific CFR differences were found in the age-c<strong>at</strong>egories10-19 <strong>an</strong>d ;,;50 years of age, in which females outnumbered males (Table 4). Therewas no signific<strong>an</strong>t associ<strong>at</strong>ion between gender <strong>an</strong>d serogroup (X' = .1; 3 df: P = .996)or clinical present<strong>at</strong>ion (X' = .0; 2 df: P = .993).There were 26 p<strong>at</strong>ients (4.8%) with a predisposing factor. The CFR among thosep<strong>at</strong>ients (19.2%) was almost 3 times higher th<strong>an</strong> th<strong>at</strong> of p<strong>at</strong>ients without a predisposingfactor (6.7%; Fisher's exact test: P = .034). Predisposed p<strong>at</strong>ients were found tosuffer more often from septicemia th<strong>an</strong> other p<strong>at</strong>ients (X' = 11.2; 2 df: P = .004).68