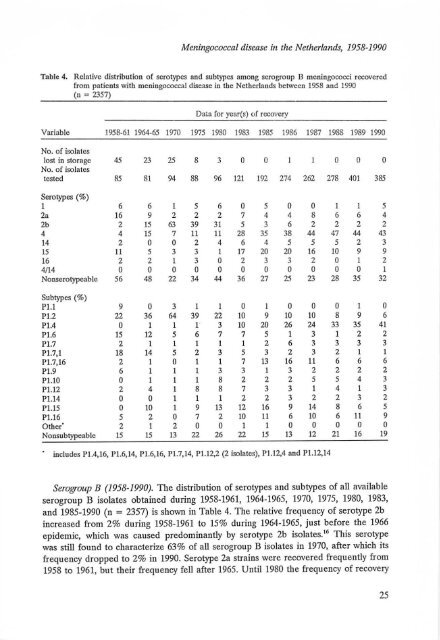
Meningococcal disease in the Netherl<strong>an</strong>ds, 1958-1990T3ble 4. Rel<strong>at</strong>ive distribution of serotypcs <strong>an</strong>d sUhtypcs among scrogroup B meningococci recoveredfrom p<strong>at</strong>ients with meningococcal disease in the Netherl<strong>an</strong>ds between 1958 <strong>an</strong>d 1990(0 = 2357)D<strong>at</strong>a for year(s) of recoveryVariable 1958-61 1964-65 1970 1975 1980 1983 1985 1986 1987 1988 1989 1990No. of isol<strong>at</strong>eslost in storage 45 23 25 8 3 0 0 0 0 0No. of isol<strong>at</strong>estested 85 81 94 88 96 121 192 274 262 278 401 385Serotypes (%)1 6 6 1 5 6 0 5 0 0 1 1 52. 16 9 2 2 2 7 4 4 8 6 6 42b 2 15 63 39 31 5 3 6 2 2 2 24 4 15 7 11 11 28 35 38 44 47 44 4314 2 0 0 2 4 6 4 5 5 5 2 315 11 5 3 3 1 17 20 20 16 10 9 916 2 2 1 3 0 2 3 3 2 0 1 24/14 0 0 0 0 0 0 0 0 0 0 0 1Nonserotypeable 56 48 22 34 44 36 27 25 23 28 35 32SUbtypes (%)1'1.1 9 0 3 1 1 0 1 0 0 0 1 0P1.2 22 36 64 39 22 10 9 10 10 8 9 6P1.4 0 1 1 1 3 10 20 26 24 33 35 41P1.6 15 12 5 6 7 7 5 1 3 1 2 21'1.7 2 1 1 1 1 1 2 6 3 3 3 3P1.7,1 18 14 5 2 3 5 3 2 3 2 1 11'1.7,16 2 1 0 1 1 7 13 16 11 6 6 6P1.9 6 1 1 1 3 3 1 3 2 2 2 2P1.10 0 1 1 1 8 2 2 2 5 5 4 3P1.12 2 4 1 8 8 7 3 3 1 4 1 3P1.14 0 0 1 1 1 2 2 3 2 2 3 2P1.I5 0 10 1 9 13 12 16 9 14 8 6 5P1.16 5 2 0 7 2 10 11 6 10 6 11 9Other 2 1 2 0 0 1 1 0 0 0 0 0Nonsubtypeablc 15 15 13 22 26 22 15 13 12 21 16 19includes 1'1.4,16, 1'1.6,14, 1'1.6,16. 1'1.7,14, 1'1.12,2 (2 isol<strong>at</strong>es), 1'1.12,4 <strong>an</strong>d 1'1.12,14Serogroup B (1958-1990). The distribution of serotypes <strong>an</strong>d subtypes of all availableserogroup B isol<strong>at</strong>es obtained during 1958-1961, 1964-1965, 1970, 1975, 1980, 1983,<strong>an</strong>d 1985-1990 (n = 2357) is shown in Table 4. The rel<strong>at</strong>ive frequency of serotype 2bincreased from 2% during 1958-1961 to 15% during 1964-1965, just before the 1966epidemic, which was caused predomin<strong>an</strong>tly by serotype 2b isol<strong>at</strong>es." This serotypewas still found to characterize 63% of all serogroup B isol<strong>at</strong>es in 1970, after which itsfrequency dropped to 2% in 1990. Serotype 2a strains were recovered frequently from1958 to 1961, but their frequency fen after 1965. Until 1980 the frequency of recovery25
Chapter 2of serotype 4 strains varied from 4% to 15%. After 1980 the proportion increasedgradually to 47% of all serogroup B isol<strong>at</strong>es in 1988, <strong>an</strong>d it stayed more or lessconst<strong>an</strong>t until 1990. Two isol<strong>at</strong>es recovered in 1990 were characterized by thecombined serotype 4/14. Serotype 15 isol<strong>at</strong>es were foun d as early as 1960. Theprevalence of this serotype during subsequent years was moder<strong>at</strong>e, but increased from1 % in 1980 to 20% during 1985-1986, after which it declined to 9% in 1990.After 1980 the subtypes P1.l6 <strong>an</strong>d P1.7,16, which were frequently linked toserotype IS, followed a time-trend sim ilar to th<strong>at</strong> of the l<strong>at</strong>ter. Before 1980 o<strong>nl</strong>y 4subtype Pl.7,16 isol<strong>at</strong>es were found. but subtype P1.16 isol<strong>at</strong>es were encounteredmore often. Isol<strong>at</strong>es of subtype P1.2 were responsible for 22% of all serogroup Binfections during 1958-1961 <strong>an</strong>d for 64% in 1970. Their frequency fell from 22% in1980 to 6% in 1990. O<strong>nl</strong>y four subtype Pl.4 isol<strong>at</strong>es were seen before 1980. Theprevalence of this sub type increased sharply from 3% in 1980 to 41 % in 1990.Subtype Pl.15 isol<strong>at</strong>es were frequently seen during 1964-1965 (10%) <strong>an</strong>d 1975 (9%).From 1980 to 1987, 9%-16% of all serogrollp B isol<strong>at</strong>es were of this sub type; itsprevalence declined to 5% in 1990. Before 1970, isol<strong>at</strong>es of subtypes P1.6 <strong>an</strong>d P1.7,1were recovered frequently from p<strong>at</strong>ients. Most isol<strong>at</strong>es were of the wellMknownsubtype combin<strong>at</strong>ions P1.7,1 <strong>an</strong>d P1.7,16; o<strong>nl</strong>y eight isol<strong>at</strong>es were of other sub typecombin<strong>at</strong>ions (P1.4,16, P1.6,14, P1.6,16, P1.7,14, P1.l2,2 [2], P1.l2,4 <strong>an</strong>d P1.l2,14).Table 5. Associ<strong>at</strong>ion of serotype <strong>an</strong>d subtypc among 2357 scrogroup B meningococci recovered (romp<strong>at</strong>ients with meningococcal disease in the Netherl<strong>an</strong>ds between 1958 <strong>an</strong>d 1990No. of isol<strong>at</strong>es of indic<strong>at</strong>ed serotypeSUbtype 1 2a 2b 4 14 15 16 4/14 NT TotalP1.1 1 0 1 4 1 0 0 0 10 171'1.2 3 91 146 25 0 1 3 0 59 3281'1.4 1 2 1 447 24 13 0 1 87 576P1.6 1 1 3 16 6 4 4 0 52 87P1.7 0 0 0 22 2 10 1 0 29 64P1.7,l 5 1 0 16 3 0 3 1 43 72P1.7,16 3 0 0 4 2 153 0 0 14 176P1.9 0 2 0 4 2 3 0 0 38 491'1.10 2 2 22 29 2 0 0 0 20 77P1.12 3 11 3 11 11 2 7 0 24 72P1.14 1 0 0 27 0 1 1 0 16 461'1.15 7 1 1 115 3 1 1 0 71 200P1.16 17 0 0 13 3 64 6 0 81 . 184O th er· 0 0 1 0 1 2 1 0 3 8NST 12 19 16 103 23 17 12 0 199 401Total 56 130 194 836 83 271 39 2 746 2357includes subtypcs P1.4,16, P1.6,14, P1.6,16, P1.7, 14, P1.12,2 (2 isol<strong>at</strong>es), P1.12,4 <strong>an</strong>d P1.12,14N01E: NT = nODscrotypeable <strong>an</strong>d NST = Donsubtypcable26