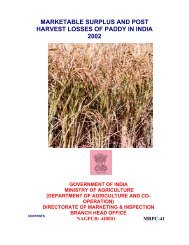
marketable surplus and post harvest losses of ragi in ... - Agmarknet
marketable surplus and post harvest losses of ragi in ... - Agmarknet
marketable surplus and post harvest losses of ragi in ... - Agmarknet
- No tags were found...

Create successful ePaper yourself
Turn your PDF publications into a flip-book with our unique Google optimized e-Paper software.
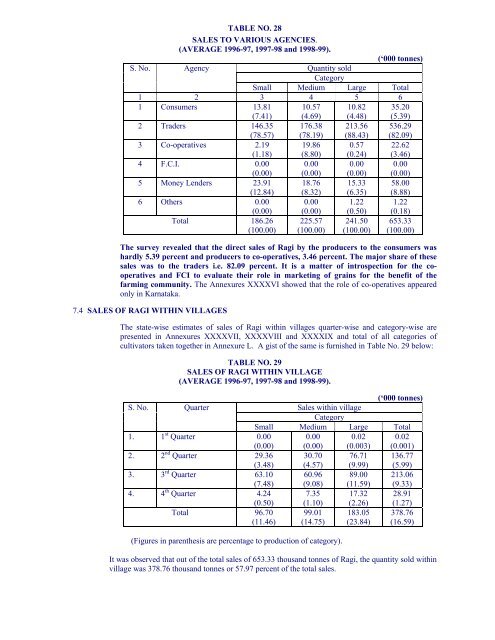
TABLE NO. 28SALES TO VARIOUS AGENCIES.(AVERAGE 1996-97, 1997-98 <strong>and</strong> 1998-99).(‘000 tonnes)S. No. AgencyQuantity soldCategorySmall Medium Large Total1 2 3 4 5 61 Consumers 13.81(7.41)10.57(4.69)10.82(4.48)35.20(5.39)2 Traders 146.35(78.57)176.38(78.19)213.56(88.43)536.29(82.09)3 Co-operatives 2.19(1.18)19.86(8.80)0.57(0.24)22.62(3.46)4 F.C.I. 0.00(0.00)0.00(0.00)0.00(0.00)0.00(0.00)5 Money Lenders 23.91(12.84)18.76(8.32)15.33(6.35)58.00(8.88)6 Others 0.00(0.00)0.00(0.00)1.22(0.50)1.22(0.18)Total 186.26(100.00)225.57(100.00)241.50(100.00)653.33(100.00)The survey revealed that the direct sales <strong>of</strong> Ragi by the producers to the consumers washardly 5.39 percent <strong>and</strong> producers to co-operatives, 3.46 percent. The major share <strong>of</strong> thesesales was to the traders i.e. 82.09 percent. It is a matter <strong>of</strong> <strong>in</strong>trospection for the cooperatives<strong>and</strong> FCI to evaluate their role <strong>in</strong> market<strong>in</strong>g <strong>of</strong> gra<strong>in</strong>s for the benefit <strong>of</strong> thefarm<strong>in</strong>g community. The Annexures XXXXVI showed that the role <strong>of</strong> co-operatives appearedonly <strong>in</strong> Karnataka.7.4 SALES OF RAGI WITHIN VILLAGESThe state-wise estimates <strong>of</strong> sales <strong>of</strong> Ragi with<strong>in</strong> villages quarter-wise <strong>and</strong> category-wise arepresented <strong>in</strong> Annexures XXXXVII, XXXXVIII <strong>and</strong> XXXXIX <strong>and</strong> total <strong>of</strong> all categories <strong>of</strong>cultivators taken together <strong>in</strong> Annexure L. A gist <strong>of</strong> the same is furnished <strong>in</strong> Table No. 29 below:TABLE NO. 29SALES OF RAGI WITHIN VILLAGE(AVERAGE 1996-97, 1997-98 <strong>and</strong> 1998-99).(‘000 tonnes)S. No. QuarterSales with<strong>in</strong> villageCategorySmall Medium Large Total1. 1 st Quarter 0.00(0.00)0.00(0.00)0.02(0.003)0.02(0.001)2. 2 nd Quarter 29.36(3.48)30.70(4.57)76.71(9.99)136.77(5.99)3. 3 rd Quarter 63.10(7.48)60.96(9.08)89.00(11.59)213.06(9.33)4. 4 th Quarter 4.24(0.50)7.35(1.10)17.32(2.26)28.91(1.27)Total 96.70(11.46)99.01(14.75)183.05(23.84)378.76(16.59)(Figures <strong>in</strong> parenthesis are percentage to production <strong>of</strong> category).It was observed that out <strong>of</strong> the total sales <strong>of</strong> 653.33 thous<strong>and</strong> tonnes <strong>of</strong> Ragi, the quantity sold with<strong>in</strong>village was 378.76 thous<strong>and</strong> tonnes or 57.97 percent <strong>of</strong> the total sales.